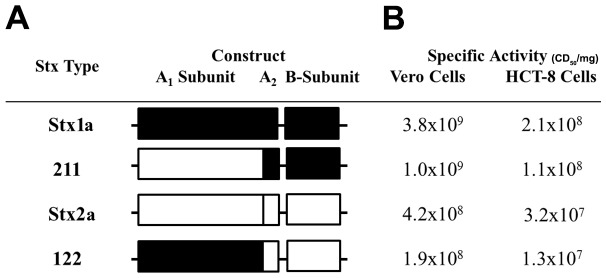
Figure 1. Native and chimeric Stx operon structure and activities.

(A) Illustration that depicts the origin of the individual subunits, A1, A2, or B, in the native and chimeric operons. Stx1a is in black, while Stx2a is in white. The chimerics are named such that the number represents the native toxin from which that subunit originated. (B) Specific activities of the toxin panel after intoxication of Vero and HCT-8 cells. Geometric mean of representative of seven biological replicates.
