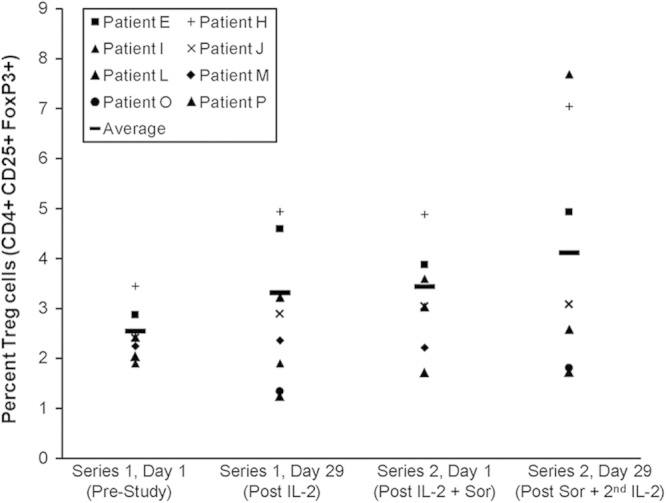
FIGURE 3.

Phenotypic analysis of natural T-regulatory cells in patient PBMCs. PBMCs from patients obtained at various timepoints were analyzed by flow cytometry for cells expressing CD4+CD25+FoxP3+ markers, consistent with a T-regulatory cell phenotype. Data are presented as the percentage of cells staining positive for these markers.
