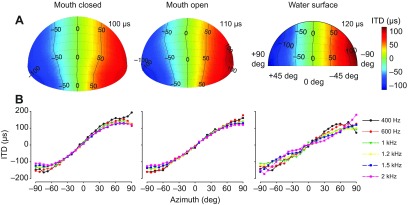
Fig. 6.

Distribution of ITD across spatial locations. (A) Spatial plots of ITD, measured using a maximum length sequence (MLS), across azimuth and elevation for the three conditions. The color bar indicates the range of ITD. The maximum ITD is noted in the upper right corner of each plot. (B) ITDs measured using short-duration pure-tone stimuli were plotted as a function of azimuth across a range of relevant frequencies for all three conditions. For both A and B: mouth closed, animal 0006F264B5; mouth open, 0006F26A75; water surface, 0006F2279C. Spatial plots were produced such that the nose of the animal is considered to project in the 0 deg position.
