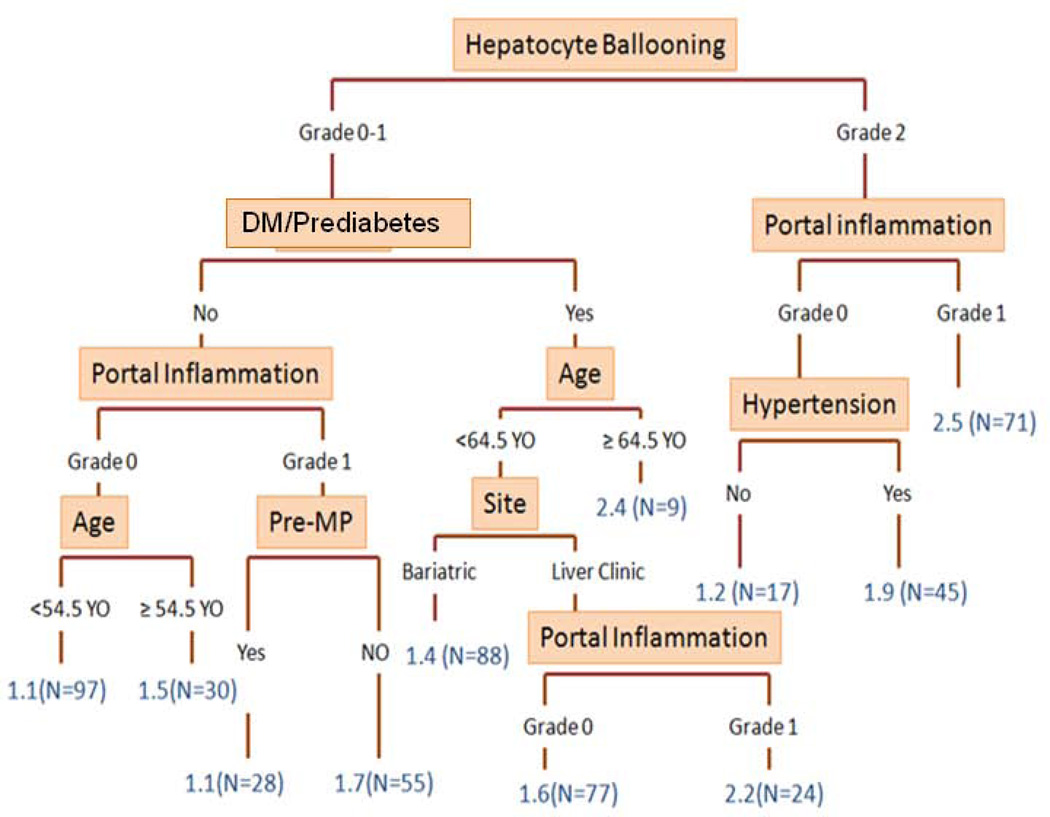
Figure 1. Conditional Inference Tree Model.
The figure demonstrates a decision tree developed with the same set of the variables used for ordinal logistic regression models. In the tree, variables with the strongest association fibrosis severity were split in a hierarchical manner. Detailed methodological explanation and relevant references were provided in the method section.
Numbers in blue: median fibrosis stage in the groups
DM: diabetes mellitus; Pre-MP: pre-menopausal women

