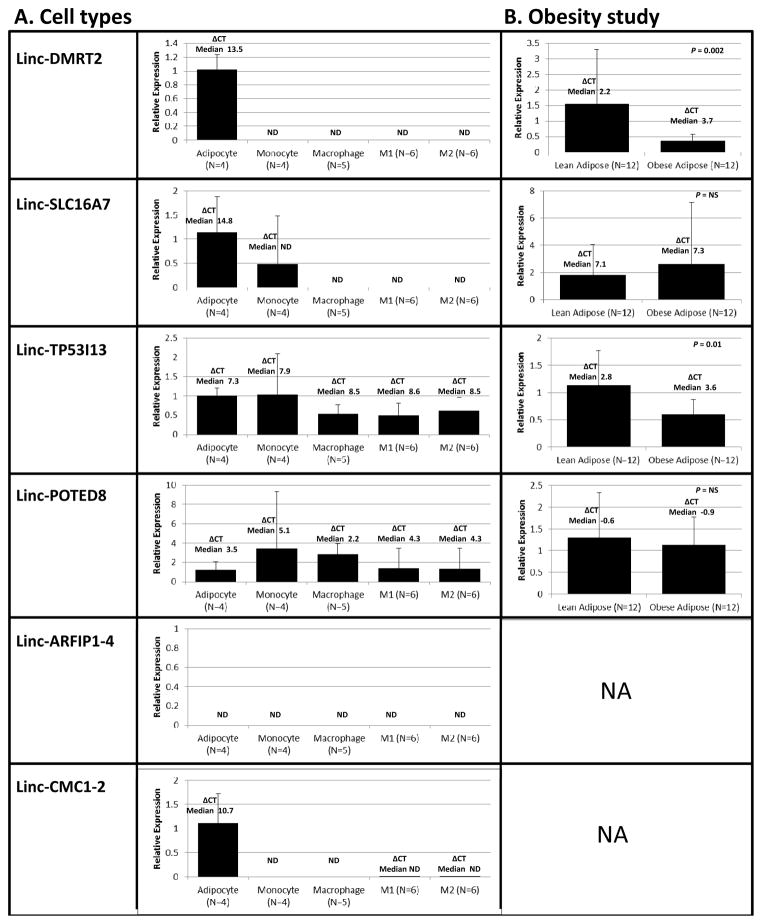
Figure 4. Translational studies of selective LPS-modulated lincRNAs.
(A) Human cells; expression of linc-DMRT2, linc-SLC16A7, linc-TP53I1, linc-POTED8, linc-ARFIP1-4, linc-CMC1-2 (by qRT-PCR), in adipocytes, primary human monocytes, macrophages, M1-type macrophages (M1), and M-2 type macrophages (M2). LincRNA expression data are presented as bar graphs of the mean (SD) fold-change in in monocytes, macrophages and M1 or M2 macrophages relative to adipocyte expression; the delta CT’s represent the median cycle threshold for lincRNAs relative to B-actin mRNA as the reference in each sample; (B) Adipose of lean vs. obese subjects; expression (by qRT-PCR) of linc-DMRT2, linc-SLC16A7, linc-TP53I1, linc-POTED8 in subcutaneous adipose of obese (n=12) compared to lean (n=12) humans. LincRNA expression data are presented as bar graphs of the mean (SD) fold-change in obese vs. lean adipose tissue. Linc-DMRT2 (P=0.002) and linc-TP53I1 (P=0.01) expression are suppressed in obesity (Mann Whitney U non-parametric test on the delta CTs). ND=not detected. NA=not assessed.

