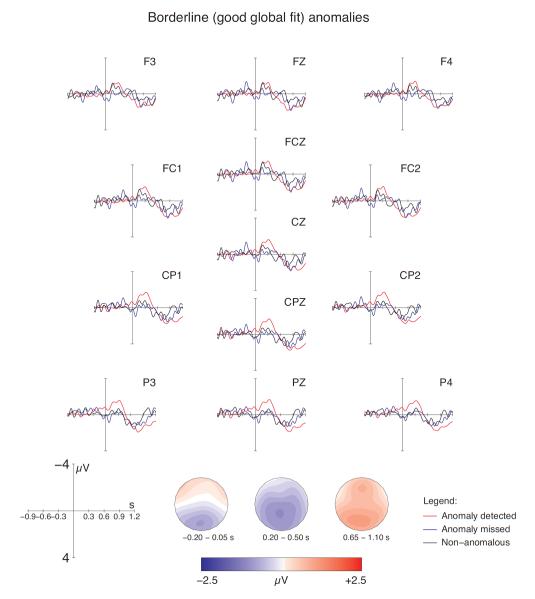
Figure C.2.
Grand average ERPs at the position of the critical word (onset at the vertical bar) in the easy-to-detect (poor global fit) anomaly conditions at 13 selected electrodes in Experiment 2a. The figure contrasts ERP responses to anomalous (red traces) and non-anomalous sentences (blue traces). Negativity is plotted upwards. The topographical maps show the scalp distribution for the voltage difference between detected anomalies and plausible sentences in the pre-onset negativity, N400 and late positivity time windows, respectively.

