
Fig 7.
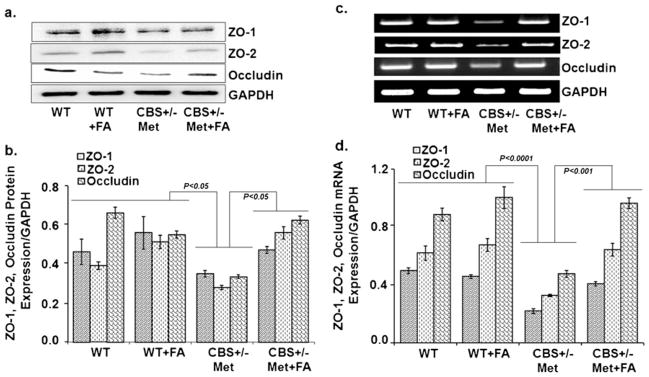
Effect of folic acid on the protein levels of tight junction proteins. a Representative Western blot images of ZO-1, ZO-2, and occludin protein expressions in WT, WT+FA, CBS+/−+Met, and CBS+/−+Met+ FA mouse brains. GAPDH was used as a loading control. b Bar graphs representing data from densitometry of ZO-1, ZO-2, and occludin expressions normalized with GAPDH. Values are expressed in arbitrary units and the data were calculated through Bio-Rad software. Data represented the mean±SE from n =4 per group. c Representative images of ZO-1, ZO-2, and occludin gene transcript expressions in different mouse brains through RT-PCR. d Densitometry analysis representing in bar graph for ZO-1, ZO-2, and occludin mRNA expressions normalized by GAPDH. Data represented mean±SE from n =4 per group