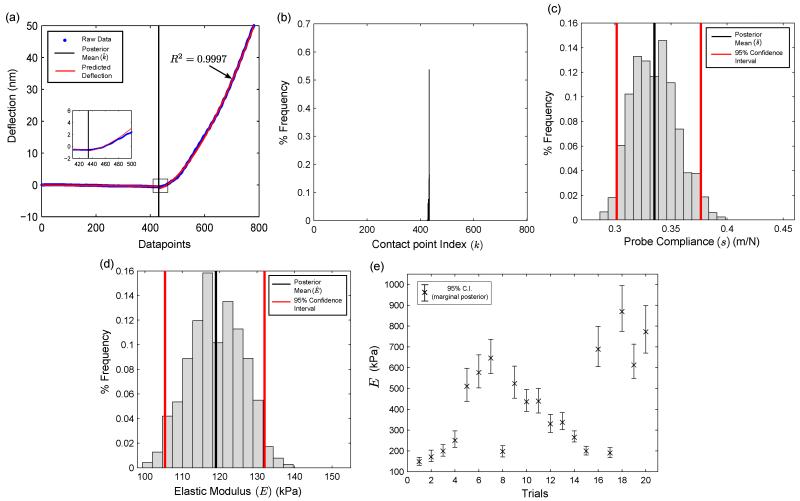
Fig. 4.
Results of Gibbs Sampling on the posterior distribution. (a) Representative AFM deflection curve on a tissue sample (n = 781) data points, (b) marginal posterior in the contact point k, (c) marginal posterior of the probe compliance s, (d) marginal posterior of elastic modulus E (linearly related to β22), and (e) mean and 95% confidence intervals on multiple datasets. Note: Only those force curves with R2 > 0.99 have been shown in Fig. 4(e).

