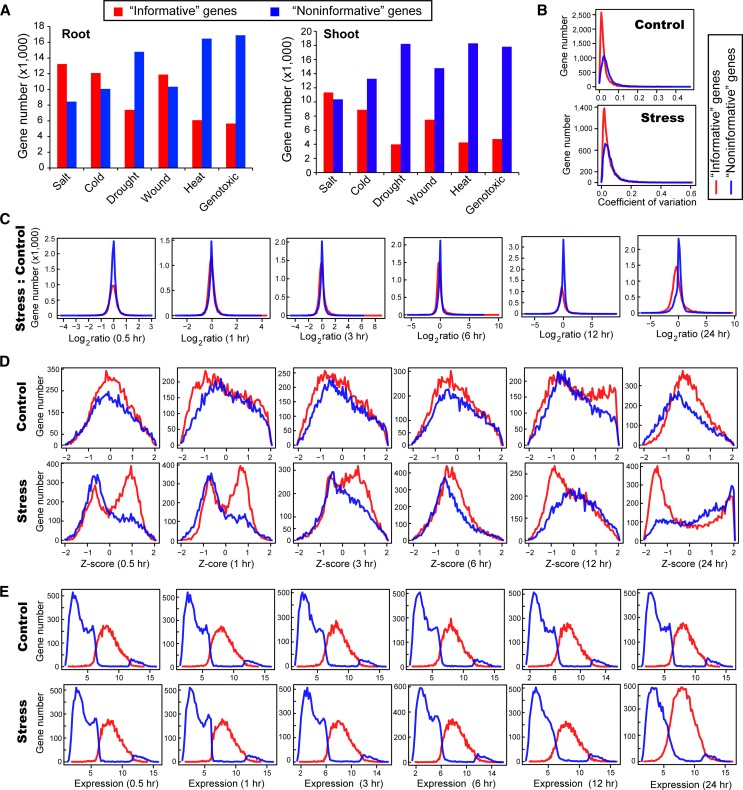
Figure 2.
Different Expression Characteristics of “Informative” and “Noninformative” Genes.
(A) Number of “informative” and “noninformative” genes under the six studied stress conditions and two tissues.
(B) Distributions of the CV of “informative” and “noninformative” genes in the cold (root) experiment.
(C) Distributions of the fold change of “informative” and “noninformative” genes in the cold (root) experiment.
(D) Distributions of the z-scores of “informative” and “noninformative” genes at the six time points in the cold (root) experiment.
(E) Distributions of the expression levels of “informative” and “noninformative” genes at the six time points in the cold (root) experiment.

