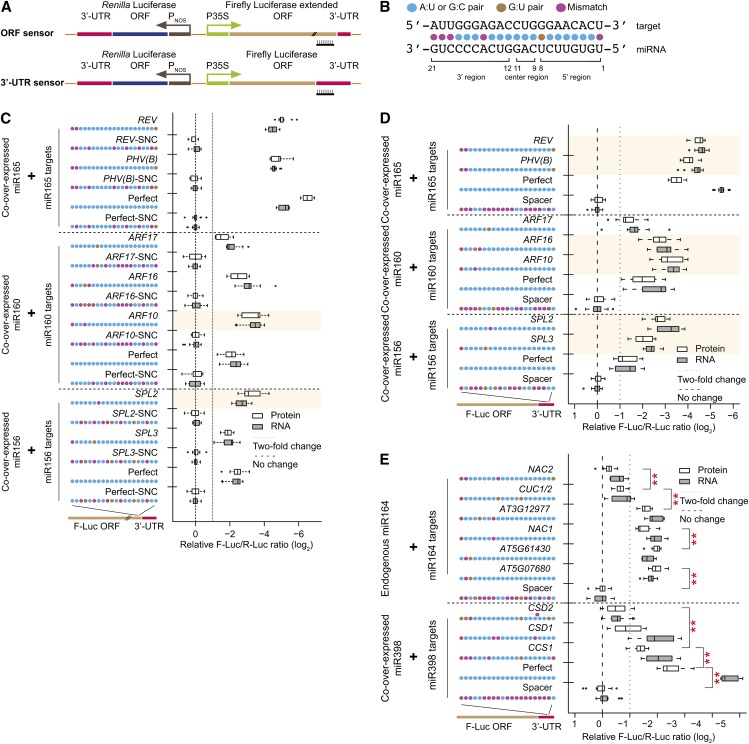
Figure 1.
Naturally Occurring Imperfect Target Sites Can Be More or Less Effective Than Perfectly Complementary Sites.
(A) Schematic diagram of dual-luciferase sensors. Top, ORF sensor; bottom, 3′-UTR sensor. P35S, promoter sequence of the cauliflower mosaic virus 35S gene; PNOS, promoter sequence of the nopaline synthase gene.
(B) Conventions for miRNA target site display and nomenclature.
(C) Naturally occurring miR156, miR160, and miR165 target sites in ORF sensors. Box plots summarize results from 15 independent replicates and show the median (thick line), extent of the 1st to 3rd quartile range (box), values extending to 1.5 times the interquartile range (whiskers), and outliers (black circles). Shaded area indicates that target protein downregulation is significantly stronger than the corresponding perfect site (P < 0.05, n = 15, ANOVA-Tukey honestly significantly different [HSD]). Synonymous negative controls (SNC) are negative controls with maximal disruption of their cognate sites while maintaining identical amino acid sequences. Target site sequences are shown in Supplemental Table 1.
(D) As in (C), except for 3′-UTR sensors.
(E) Naturally occurring miR164 and miR398 sites in 3′-UTR sensors. ORF sensor data are in Supplemental Figure 1. Data display conventions as in (C). Double asterisks indicate significant differences at the protein level between two adjacent groups (P < 0.05, n = 15, ANOVA-Tukey HSD).

