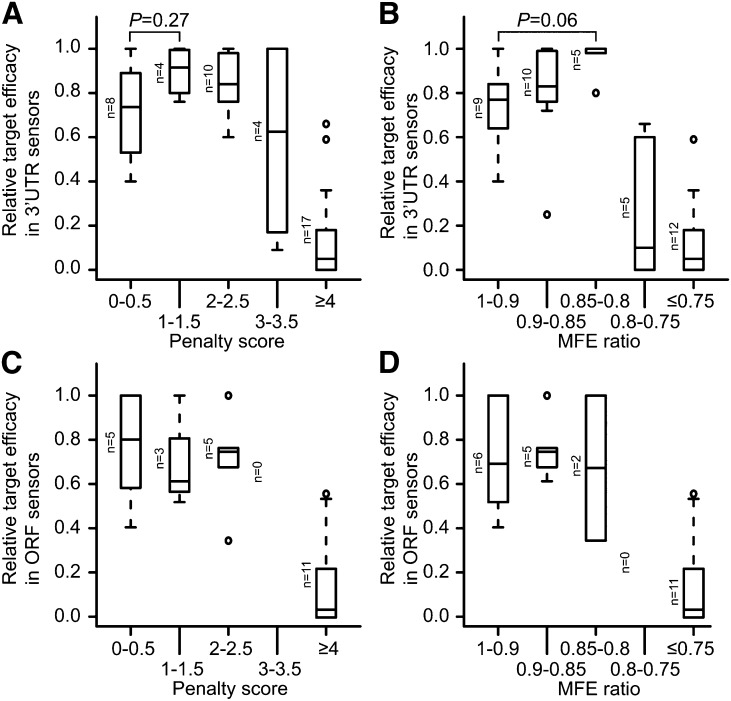
Figure 8.
Correlation of Target Site Scores with Protein-Level Efficacies.
(A) Box plots of relative target efficacy in 3′-UTR sensors at the protein level with respect to target penalty score. Target penalty score was calculated according to Allen et al. (2005) (P = 0.27, Mann-Whitney U-test).
(B) As in (A) except for the MFE ratio between the sites and a perfectly complementary site (P = 0.06, Mann-Whitney U-test).
(C) As in (A) except for ORF sensors.
(D) As in (B) except for ORF sensors.

