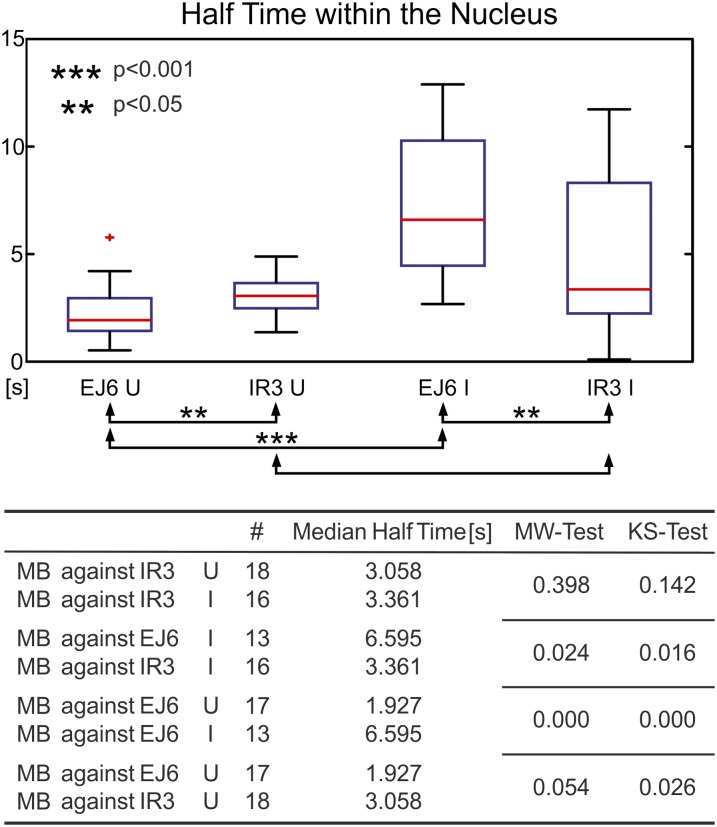
Figure 5.
Dynamics of MB-Labeled Splice Variants within the Nucleoplasm Measured by FRAP Experiments.
Box-plot representation of the half-time of recovery after bleaching a defined spot within the nucleoplasm. Results are shown for MBs against EJ6 of RS2Z33 in induced/uninduced cells as well as MBs against IR3 in induced and uninduced cells. FS variants move faster than intron 3–containing variants. mRNA derived from a cDNA gene moves slower than naturally processed FS mRNA. The median and outcome of the statistical tests are depicted in the table at bottom. I, induced; U, uninduced; #, number of cells.
[See online article for color version of this figure.]

