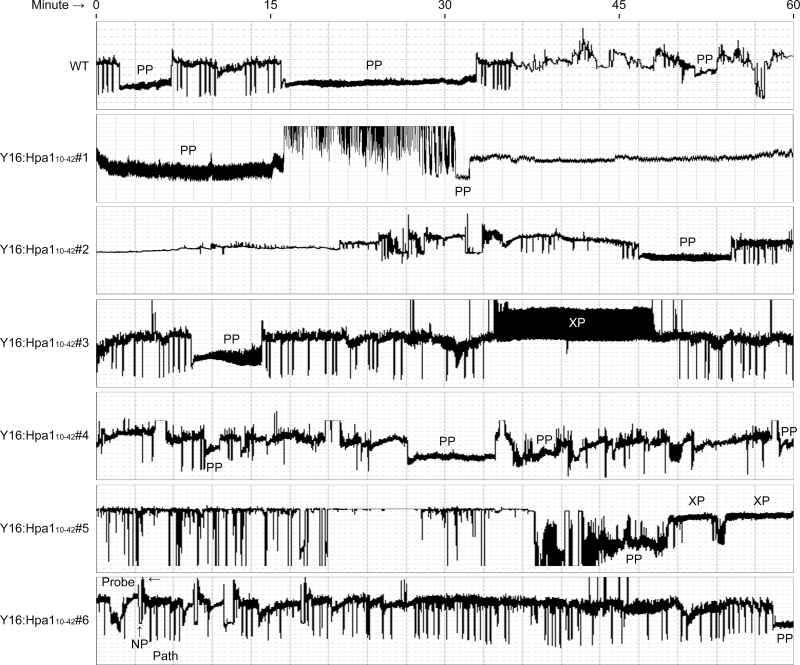
Fig. 3.
Electrical penetration graph (EPG) showing aphid feeding on leaves of the wheat cultivar Y16 and transgenic Y16:Hpa110–42 lines. Uniform nymphs of the second instar were placed on the upper sides of the top first expanded leaves. The second hour parts of 6h EPG records are shown. Aphid feeding activities are divided into several distinct phases detected as distinct EPG waveforms. ‘Probe’ refers to aphid stylet puncturing of the plant cell; ‘NP’ indicates non-puncturing; ‘Path’ means pathways of stylet movements in fascicular cells; ‘XP’ and ‘PP’ refer to xylem and phloem phases when stylets take up soaps from the xylem and phloem, respectively. Note that other waveforms appear in some of the predominant PP spans. (This figure is available in colour at JXB online.)

