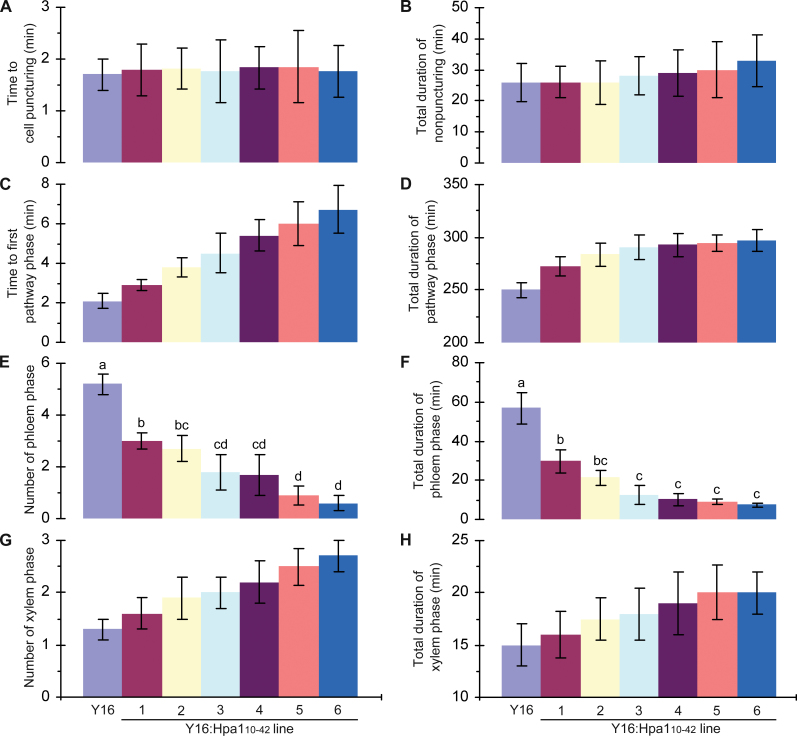
Fig. 4.
Quantitative presentation of 6h EPG records. Major parameters that reflect aphid feeding activities are provided in (A–H). Values shown are means ±SD of results obtained from monitoring of 40 aphids placed on the top first expanded leaves of five plants. In (E, F), different letters indicate significant differences among compared plants by one-tailed ANOVA and LSD test (P<0.01). (This figure is available in colour at JXB online.)

