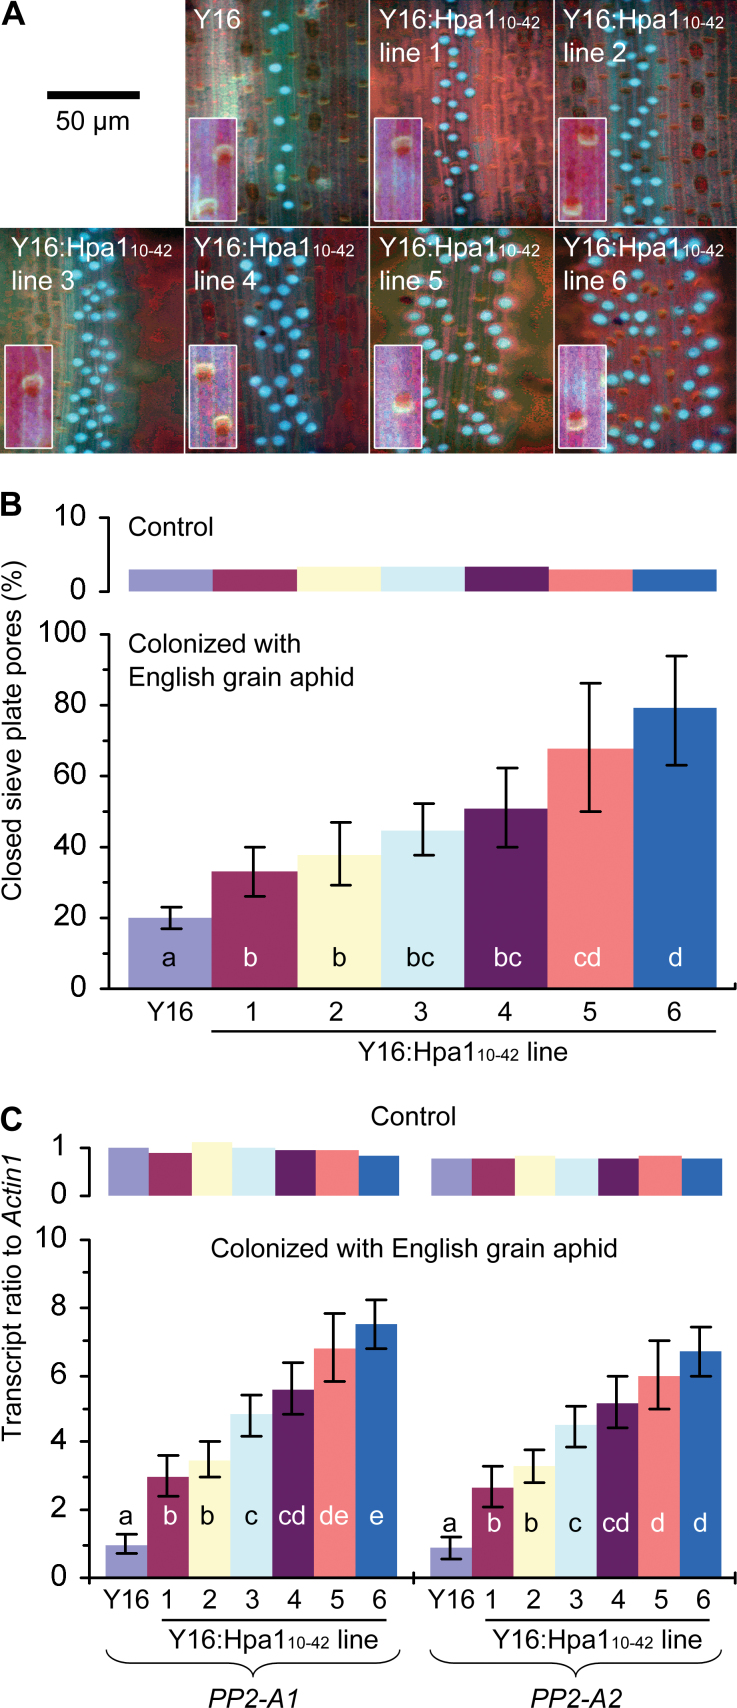
Fig. 5.
Callose deposition and PP2-A expression in leaves of Y16 and Y16:Hpa110–42 plants. (A–C) Plants were colonized with English grain aphid or not colonized in the control. Six hours later, callose deposition and PP2-A expression were analysed. (A) In plants colonized with aphids, callose deposition in the vascular bundles of leaf middle veins was visualized as a blue colour by staining the leaves with aniline blue. Insets show sieve plates from leaves of control plants. (B) Proportions of callose-closed sieve plate pores were scored from imaging data equivalent to those in (A). In total 750–1250 sieve plates were observed in three experimental repeats for a genotype of plant (Y16 or each of the Y16:Hpa110–42 lines). Data shown are mean values ±SD. (C) PP2-A/Actin1 transcript ratios were quantified by real-time RT–PCR as mean values ±SD of results from three experimental repeats (15 plants/repeat). In (B, C), different letters on the bar graphs indicate significant differences among compared plants by one-tailed ANOVA and LSD test (P<0.01).

