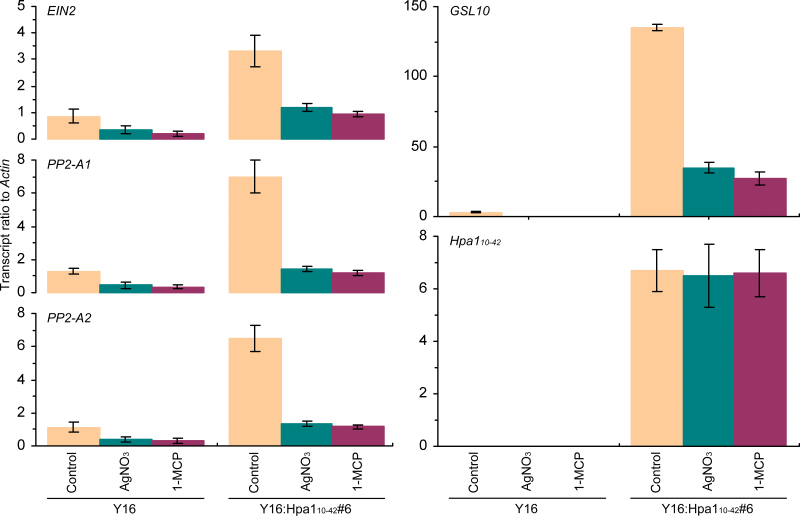
Fig. 7.
The effects of ethylene signalling inhibitors on the expression of EIN2, PP2-A, and GSL genes tested in comparison with Hpa1 10–42. Plants were colonized with aphids and simultaneously treated with water (control) and with the ethylene signalling inhibitor AgNO3 or 1-methylcyclopropene (1-MCP). Six hours later, gene expression was analysed. Data shown are mean values ±SD of results from three experimental repeats (10 plants per repeat). (This figure is available in colour at JXB online.)

