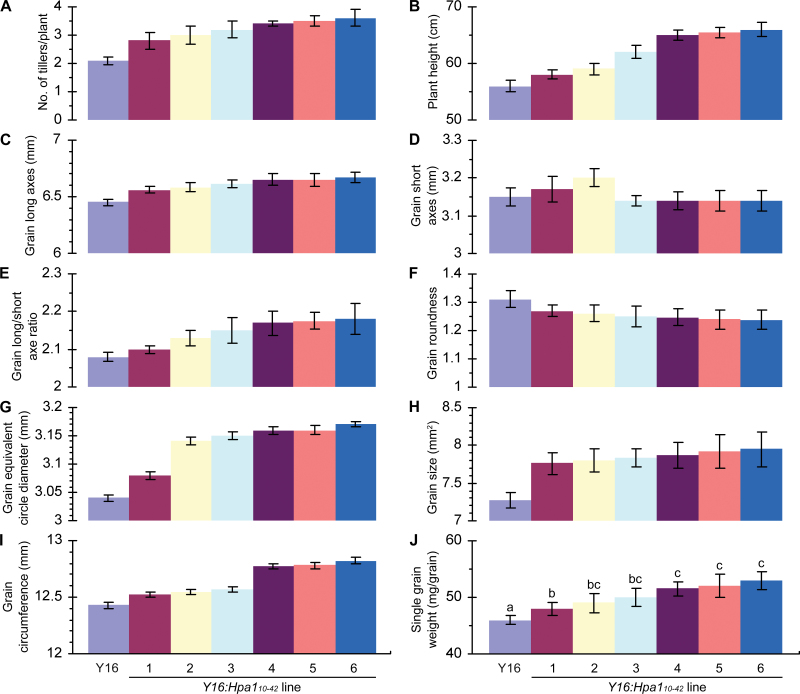
Fig. 9.
Analyses of wheat growth and grain characters. (A, B) Tillers were counted after the first flowering day and plant height was measured based on the tallest ear. (C–J) Morphological characters of grains were analysed by a seed analyser. (A–J) Data shown are mean values ±SDs of results from three experimental repeats (50 plants or 15g of grains per repeat). In (J), different letters on the SD bars indicate significant differences among compared plants by one-tailed ANOVA and LSD test (P<0.01). (This figure is available in colour at JXB online.)

