Fig. 3.
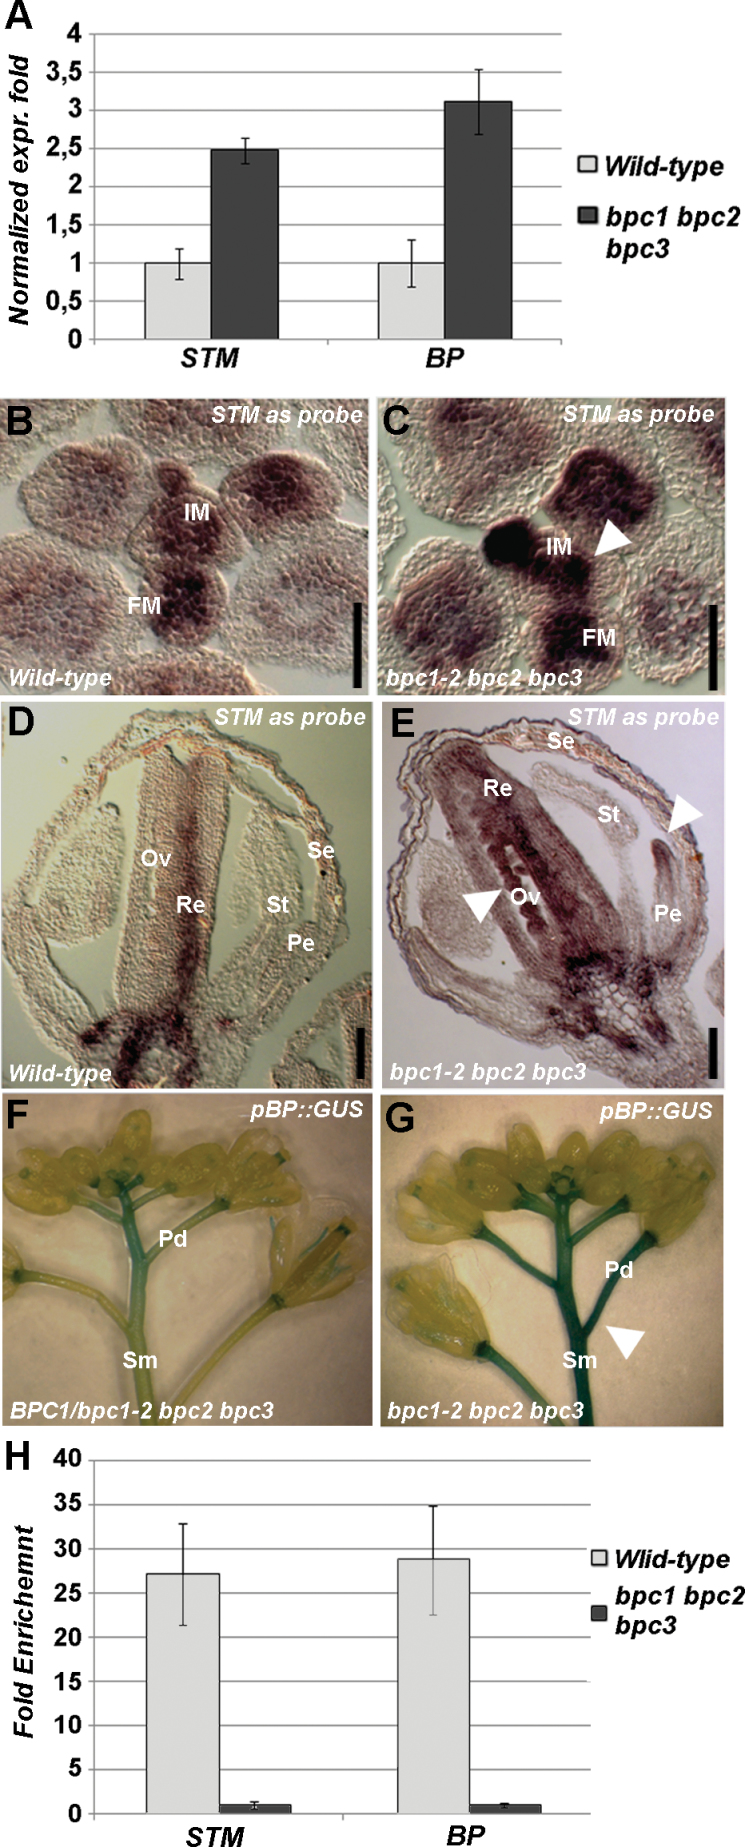
STM and BP are direct targets of class I BPCs. (A) qRT-PCR of the wild type and bpc1-2 bpc2 bpc3 triple mutant to determine STM and BP expression levels. (B–E) In situ hybridization using an STM-specific antisense probe of transversal sections of (B, D) and wild-type (C, E) bpc1-2 bpc2 bpc3 inflorescences. The signal was more intense and expanded in the meristems of the mutant (arrowhead in B). In the wild-type flower, the signal was localized in the replum and at the base of the flower, whereas in the triple mutant it was also in the petal and ovules (arrowheads in E). (F, G) GUS staining of BPC1/bpc1-2 bpc2 bpc3 (F) and bpc1-2 bpc2 bpc3 (G) inflorescences of plants containing the pBP::GUS construct. In the homozygous triple mutant, the signal was expanded and more persistent in both the pedicels and stems (arrowhead in G). (H) ChIP analysis revealing that BPCs of class I directly bind the STM and BP promoter; the bpc1-2 bpc2 bpc3 was used as a negative control. Each bar shows the average of three independent ChIP experiments (±standard deviation). Pe, petals; Se, sepals; St, stamen; Re, replum; Ov, ovules; Sm, stem; Pd, pedicel. Bars, 50 µm. (This figure is available in colour at JXB online.)

