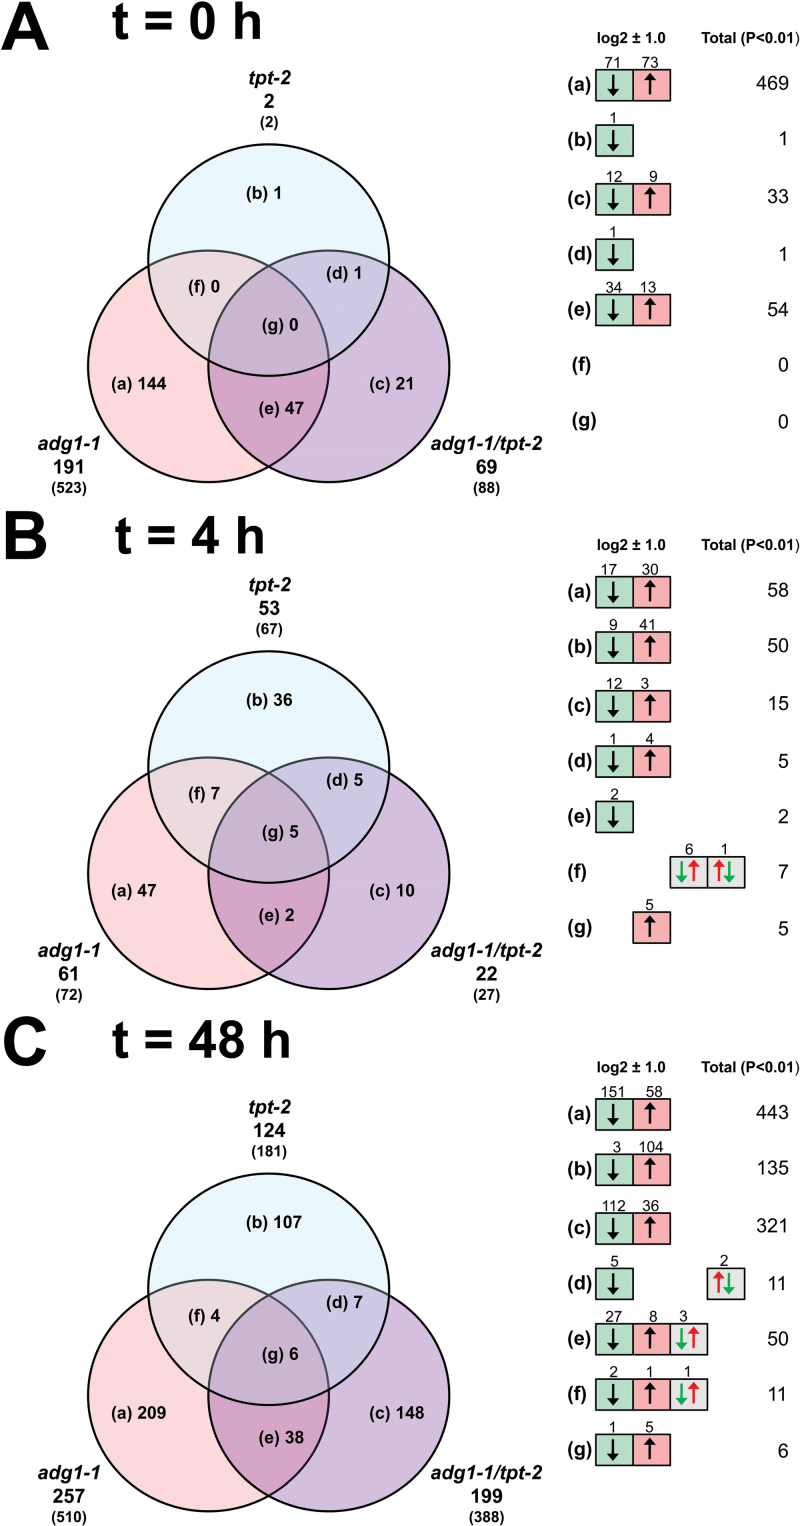
Fig. 6.
Venn diagrams showing ‘static’ comparisons of differentially regulated genes between mutant and wild-type plants at t=0h (A), t=4h (B), and t=48h (C). Genes that were significantly (P<0.01) altered at a threshold of log2 ratios of ±1.0 are displayed. The numbers in parentheses and in the right panel represent total numbers of significantly altered genes without any threshold. (This figure is available in colour at JXB online.)

