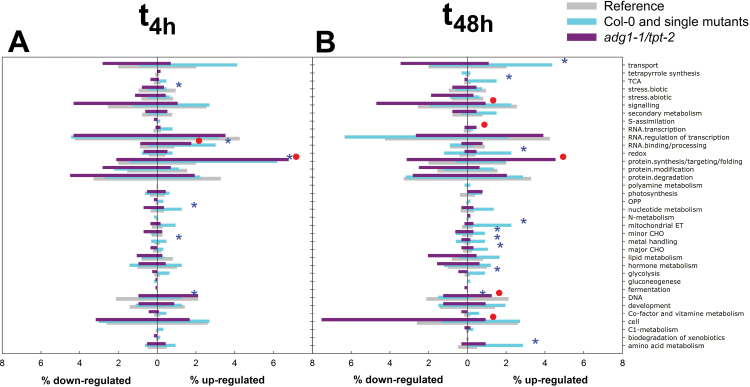
Fig. 8.
MapMan binning-based distribution of up- and down-regulated genes in individual functional categories 4h (A) and 48h (B) after LL/HL transfer. The reference value (light grey bars) refers to the number of genes belonging to a certain category expressed as a percentage of all genes on the microarray, whereas intermediate grey and dark grey bars refer to the number of up- or down-regulated genes belonging to a certain category as a percentage of all differentially regulated genes. Intermediate grey bars refer to all genes not regulated in adg1-1/tpt-2 (i.e. genes regulated in Col-0 and the single mutants) and dark grey bars refer to genes specifically regulated in adg1-1/tpt-2. Significant differences (P<0.05) in the relative distribution amongst the individual categories were estimated by Fisher’s exact test and marked by either asterisks or circles for intermediate grey or dark grey bars, respectively. (This figure is available in colour at JXB online.)

