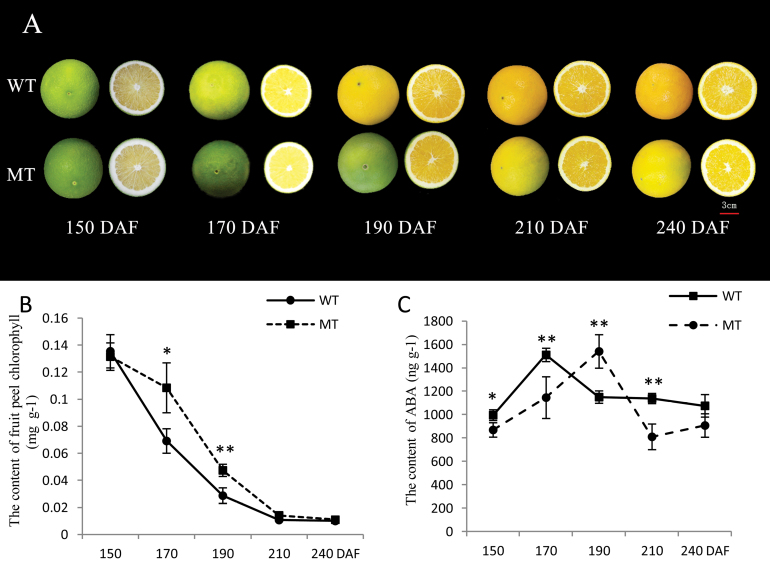
Fig. 1.
(A) Phenotypic characterization of fruit development in MT and WT. (B) Chlorophyll content in the fruit peel of MT and WT at five developmental stages. (C) ABA content in the fruit pulp of MT and WT at five developmental stages. Bars represent the standard error (SE; n=3). Asterisks represents statistically significant differences (*P<0.05; **P<0.01) analysed using Student’s t-test. (This figure is available in colour at JXB online.)

