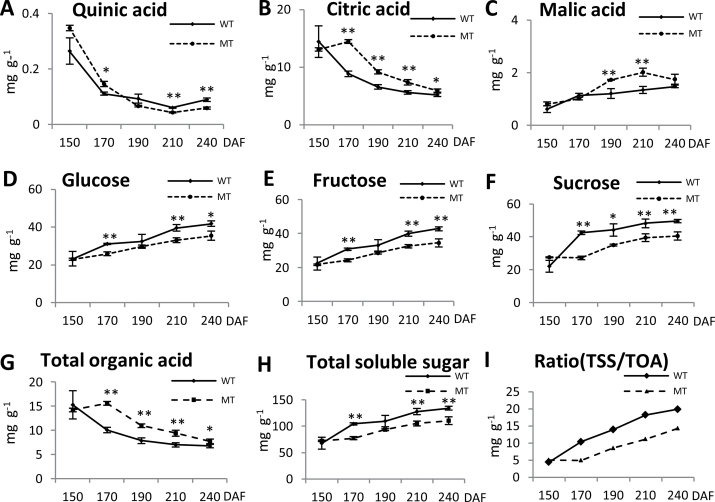
Fig. 2.
Trends in organic acid and soluble sugar content in MT and WT fruit pulp (fresh weight) during fruit ripening. Quinic acid (A), citric acid (B), malic acid (C), glucose (D), fructose (E), and sucrose (F) content were extracted at 150, 170, 190, 210, and 240 DAF. Three individual replicates were used to reduce the experimental error. The total organic acid (TOA; G) and total soluble sugar (TSS; H) were the sum of the organic acids (malic acid, citric acid, and quinic acid) and the soluble sugars (fructose, glucose, and sucrose), respectively. The ratio of TSS:TOA was determined (I). Bars represent the SE (n=3). Asterisks represents statistically significant differences (*P<0.05; **P<0.01) analysed using Student’s t-test.

