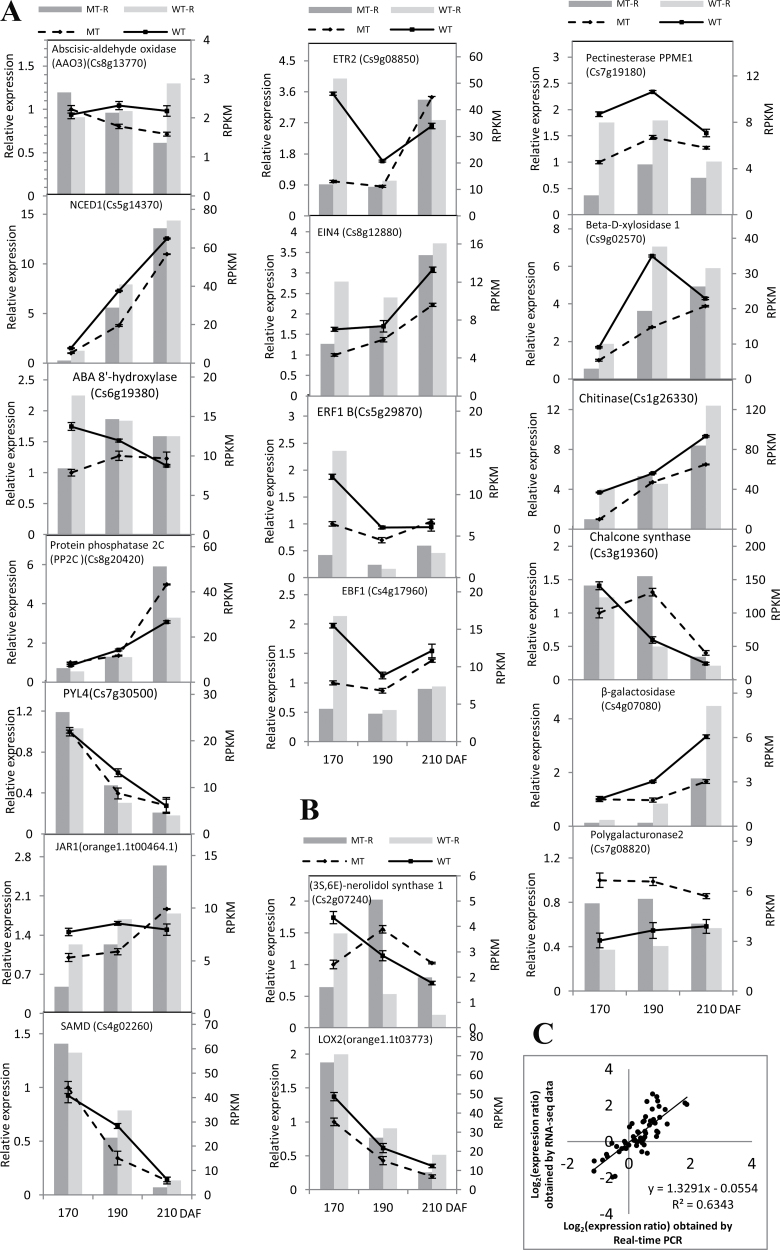
Fig. 5.
qRT-PCR validation of differential expression. (A, B) Transcript levels of 19 genes, of which 11 involve plant hormone synthesis and signal transduction (A), and eight are most likely associated with fruit development and ripening (B), in WT (solid lines) and MT (broken lines) and the corresponding expression data of RNA-seq. WT-R: the data for RNA-seq in WT; MT-R: the data for RNA-seq in MT. The y-axis shows the relative gene expression levels analysed by qRT-PCR. The bars represent SE (n=3). (C) Comparison between the gene expression ratios obtained from RNA-seq data and qRT-PCR. The RNA-seq log2 value of the expression ratio (y-axis) has been plotted against the developmental stages (x-axis).

