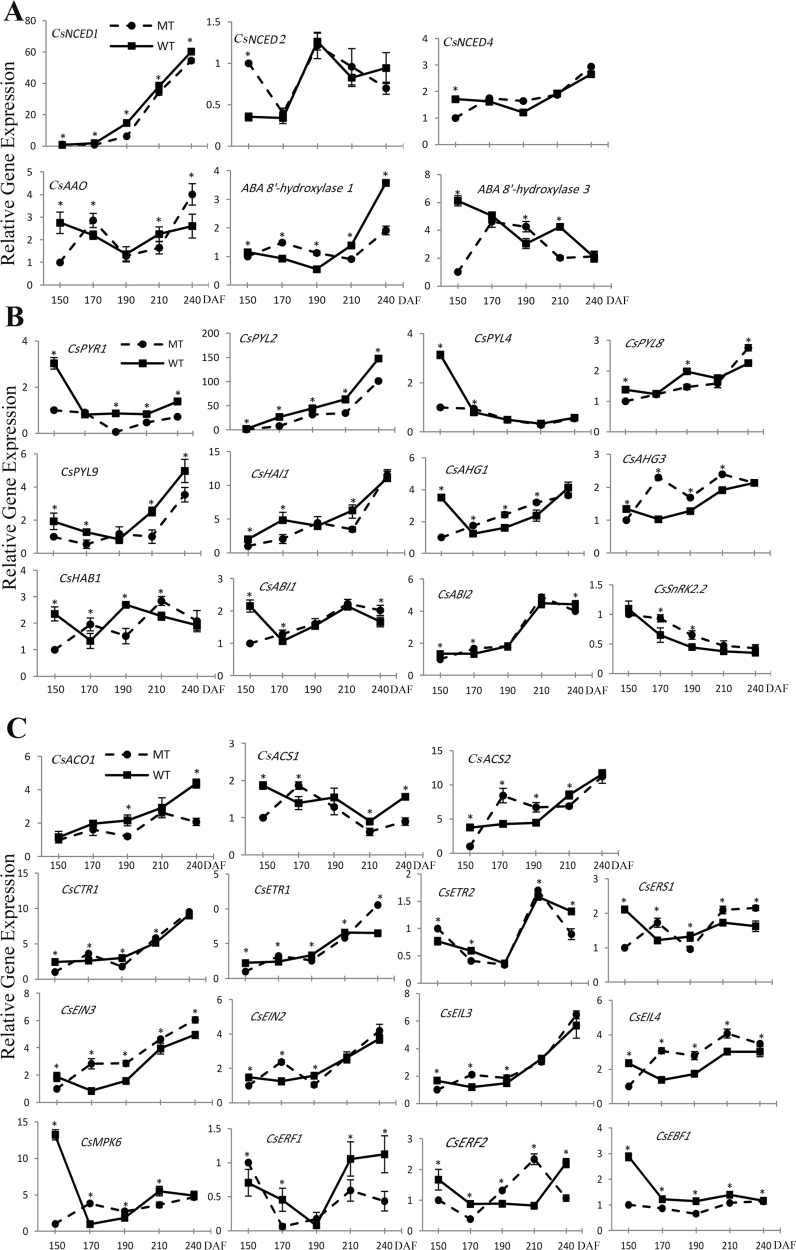
Fig. 6.
Transcript levels of genes in the ABA biosynthesis pathway (A), ABA signal transduction pathway (B,) and ethylene biosynthesis and signal transduction pathways (C). Bars represent the SE (n=3). An asterisk represents a statistically significant difference (P<0.05) analysed using Student’s t-test.

