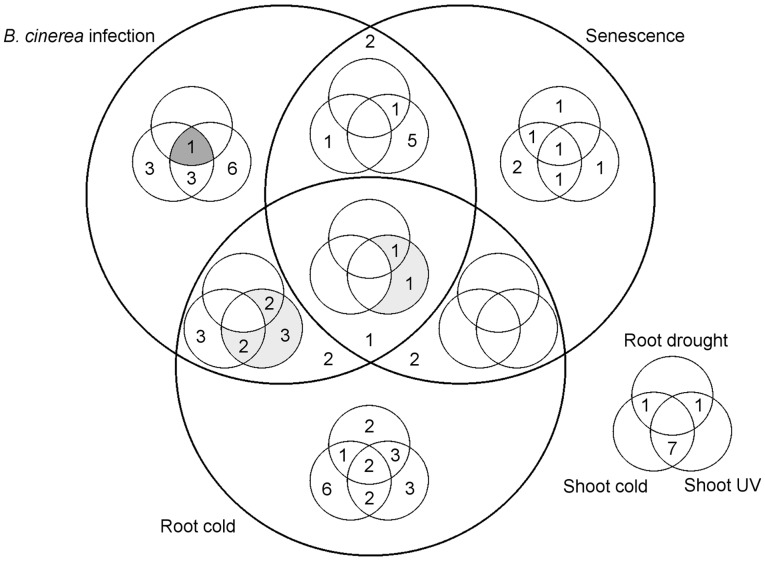
Fig. 5.
The number of modules identified for each combination of conditions. Three conditions are represented by large circles; the other three by small circles. Evidence for dependent co-expression was found across a range of combinations of conditions, ranging from two time series up to five time series. By analyzing the number of modules detected for different combinations of conditions, network reconstruction efforts can be focused on time series combinations showing evidence for shared regulatory mechanisms. The nine modules featuring B.cinerea infection, root response to cold and shoot response to UV light are shaded light grey. The single module spanning B.cinerea infection, root response to drought and shoot response to cold is shaded dark grey

