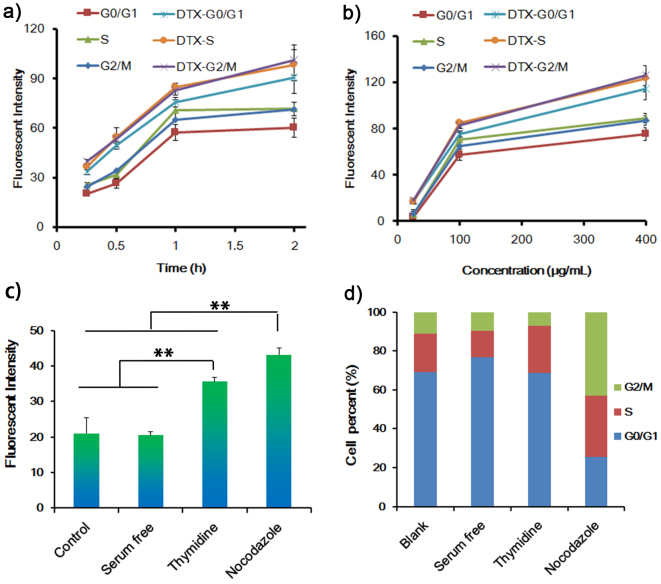
Figure 2. Cell cycle uptake of FITC-NPs.
(a) Different cell cycle uptake of 100 μg/mL of FITC-NPs for vary times after U87 cells pretreated with 0.1 μg/mL of DTX for 24 h. (b) Different cell cycle uptake of different concentrations of FITC-NPs for 1 h after U87 cell pretreated with 0.1 μg/mL of DTX for 24 h. (c) Cell uptake of 100 μg/mL of FITC-NPs for 1 h after cells synchronized by different conditions, no-treated cells were used as control. (d) Cell cycle distribution after synchronized by different conditions, no-treated cells were used as control. **p < 0.01. (n = 3).

