
Figure 5. Ex vivo imaging and tissue distribution of DiR-NPs.
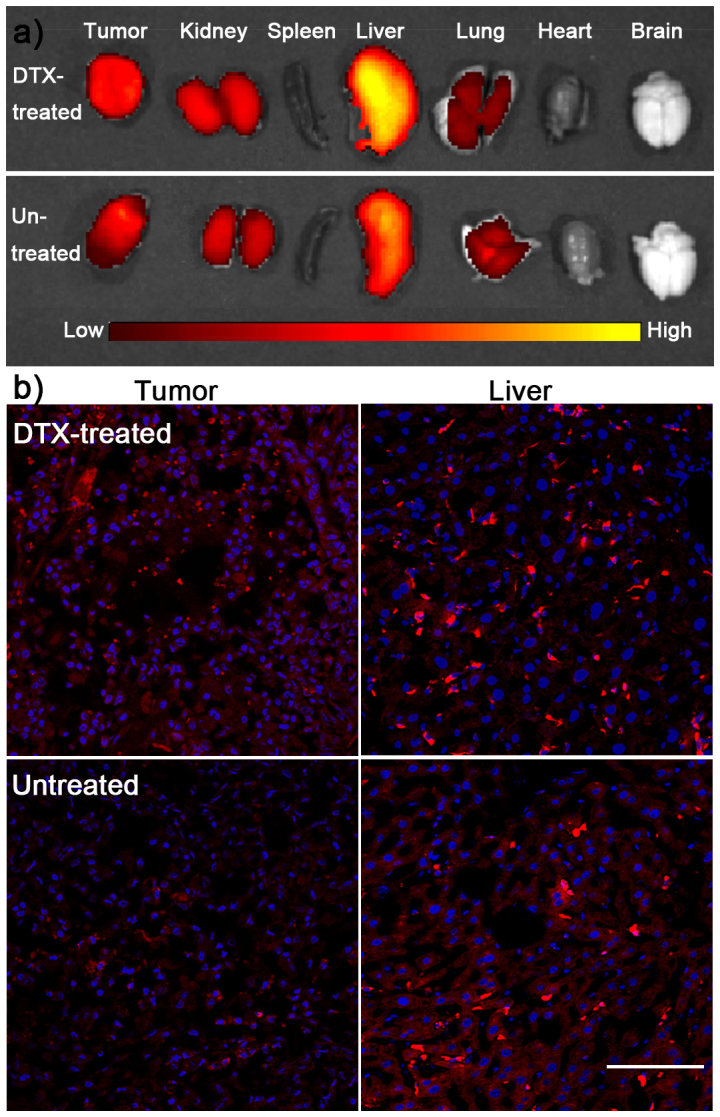
(a) Ex vivo imaging of organs from DiR-NPs treated mice that pretreated or untreated with 20 mg/kg of DTX. (b) Semi-quantitative of fluorescent intensity in different organs. (c)Fluorescence distribution in tumor and liver from DiR-NPs treated mice that pretreated or untreated with 20 mg/kg of DTX. Bar represents 100 μm.