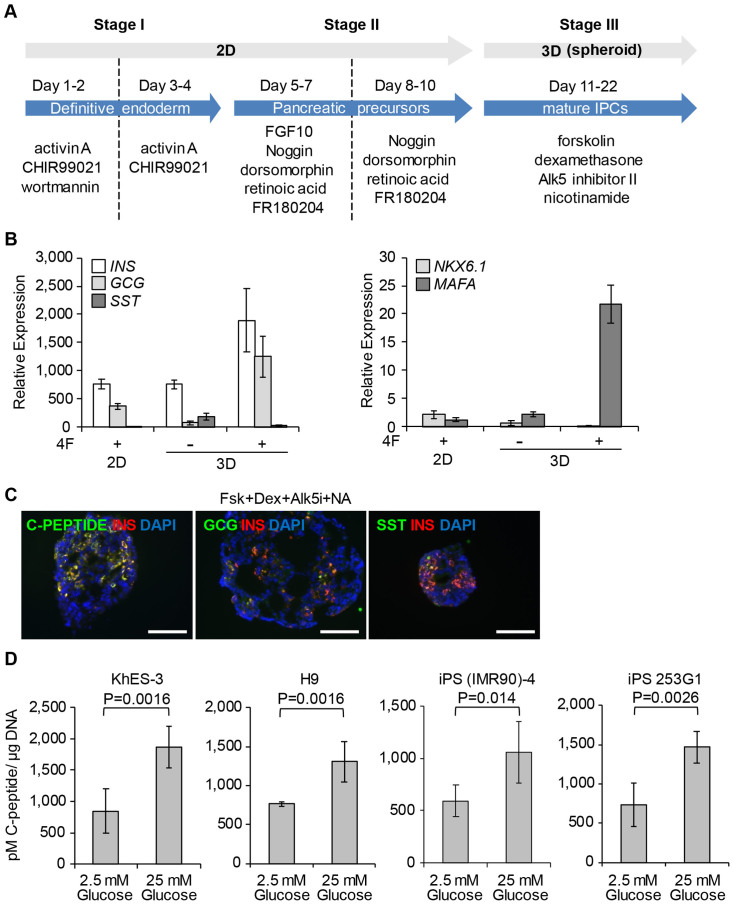
Figure 4. Differentiation into mature IPCs in 3D culture.
(A) Scheme of differentiation into IPCs in 3D culture. (B) Quantitative PCR analysis of the expression of NKX6.1, MAFA, INS, GCG and SST in cells treated with each factor at day 22. Expression levels were normalized to TBP expression. mRNA expression was relative to that in control cells at day 22. Control cells were treated with each factor for 10 days as shown in Fig. 4A, and then without factors for 12 days in 2D culture. Error bars indicate SD (n = 3). (C) Immunostaining of C-PEPTIDE, GCG, SST and INS proteins in cells treated with each factor in 3D culture at day 22. INS+ cells were 31.4 ± 2.7% of total cells. INS+/GCG+ cells were 6.8 ± 2.4% of total cells. Mean ± SD (n = 5). (D) C-peptide secreted in response to low (2.5 mM) and high (25 mM) concentrations of D-glucose was measured with a C-peptide ELISA kit at day 22 (3D culture) in each hPSC line. Error bars indicate SD (n = 5). Fsk, 10 μM forskolin; Dex, 10 μM dexamethasone; Alk5i, 5 μM Alk5 inhibitor II; NA, 10 mM nicotinamide. Scale bar, 100 μm.

