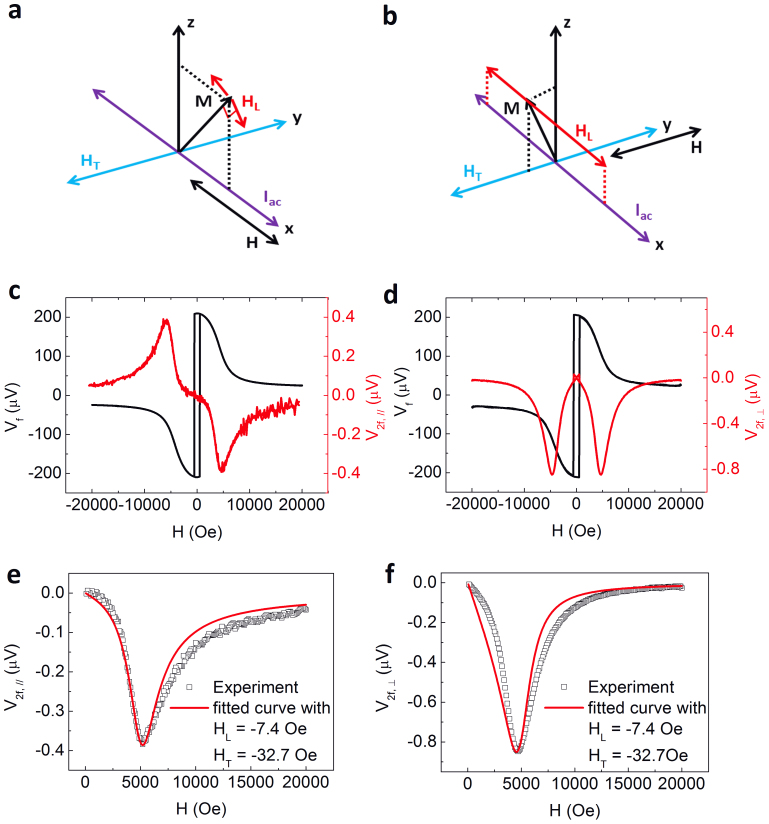
Figure 2. Schematics of two measurement schemes and current induced spin-orbit effective fields.
(a), (b), Directions of HL and HT with H along and transverse to Iac. First and second harmonic loops under these two schemes are shown in (c), (d), measured at θH = 4° and 300 K. (e) and (f) show the fitting of second harmonic voltage curves. The fitted HL and HT values are indicated in the graphs.

