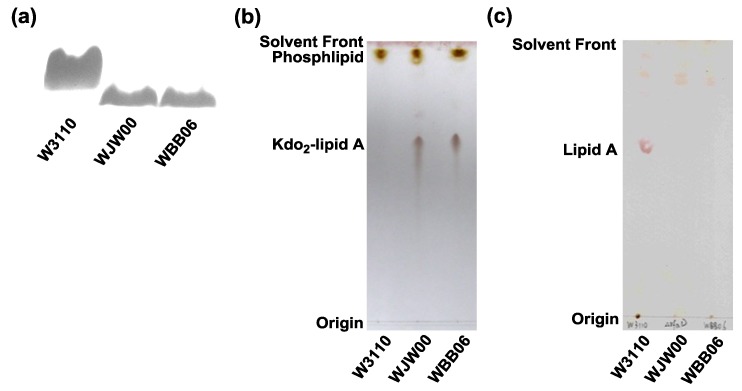
Figure 3.
Comparison of lipids composition in E. coli strains W3110, WBB06 and WJW00. (a) The silver-stained SDS-PAGE analysis of LPS isolated from W3110, WJW00 and WBB06; (b) thin layer chromatography (TLC) of lipids directly extracted from W3110, WJW00 and WBB06; and (c) TLC of lipid A extracted from cells of W3110, WJW00 and WBB06.

