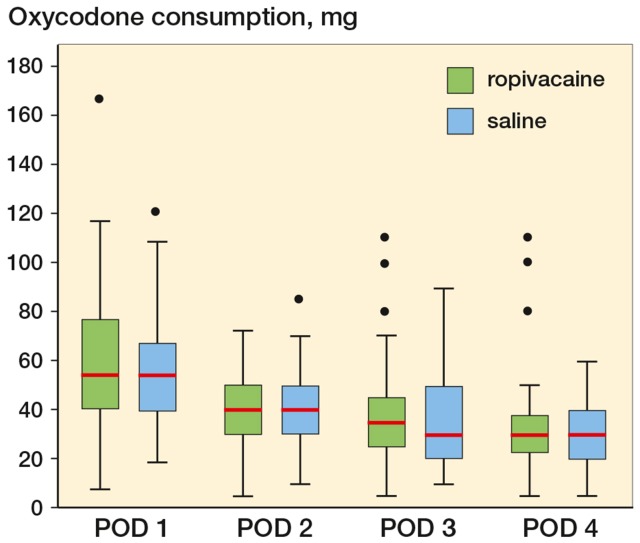
Figure 2.
Boxplot showing median oxycodone consumption postoperative day (POD) 1–4. POD 1: p = 0.66, POD 2: p = 0.86, POD 3: p = 0.57, and POD 4: p = 0.85. Boxes indicate median with 25th and 75th percentilrs and whisker caps indicate 10th and 90th percentiles. Dots show each observation outside whiskers.

