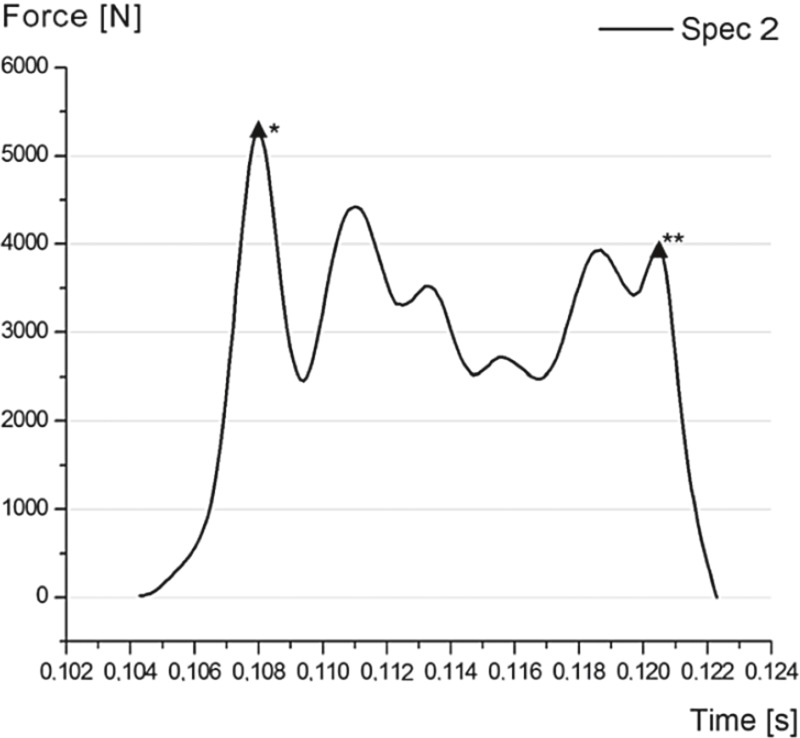
Figure 5.
Curve representing force over time in specimen 2. * marks the moment of failure of the interosseous membrane, as in Figure 3C. ** marks the moment of fracture and proximalization of the radius, as in Figure 4B. The irregular lines in-between can be explained by dislocation movements of the radial head before the fracture, resulting in complete longitudinal instability.

