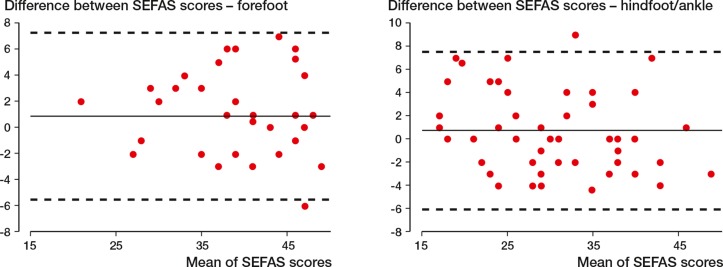
Agreement in scores of patients with forefoot disorders (n = 37) and of patients with hindfoot or ankle disorders (n = 52) for SEFAS presented as Bland-Altman plots (Bland and Altman 1986). The solid line represents the mean value and the dotted lines show the limits for 2 standard deviations (SDs) above and below the mean value.

An official website of the United States government
Here's how you know
Official websites use .gov
A
.gov website belongs to an official
government organization in the United States.
Secure .gov websites use HTTPS
A lock (
) or https:// means you've safely
connected to the .gov website. Share sensitive
information only on official, secure websites.
