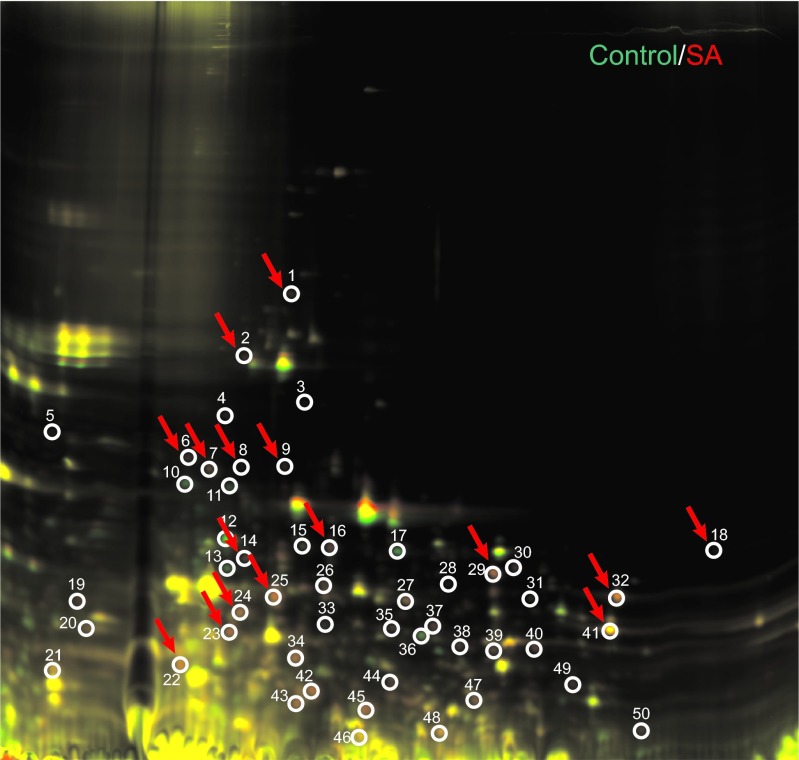
Figure 6.
2D-DIGE gel showing P. gingivalis protein differences in untreated and sapienic acid-treated samples. Red spots indicate upregulation of proteins in treated samples and green spots indicate downregulated proteins, relative to the control sample. Yellow spots indicate colocalization (where the same proteins were present in both samples). We chose 16 spots (red arrows) for further analysis and sequenced them by mass spectroscopy. 2D-DIGE, two-dimensional in-gel electrophoresis.

