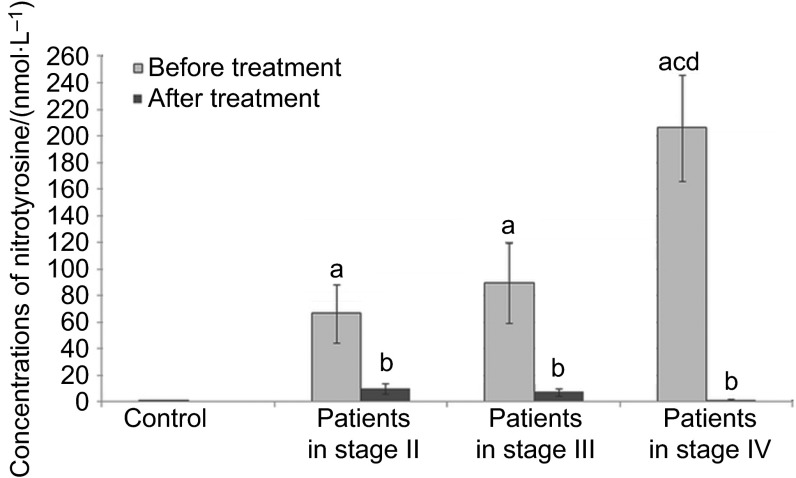
Figure 3.
Concentrations of nitrotyrosine in the serum of patients in different stage of disease. a, Statistical differences with control (P<0.05); b, statistical differences between patients before and after treatment (P<0.05); c, statistical differences between patients in stage II and patients in stage IV (P<0.05); d, statistical differences between patients in stage III and patients in stage IV (P<0.05).

