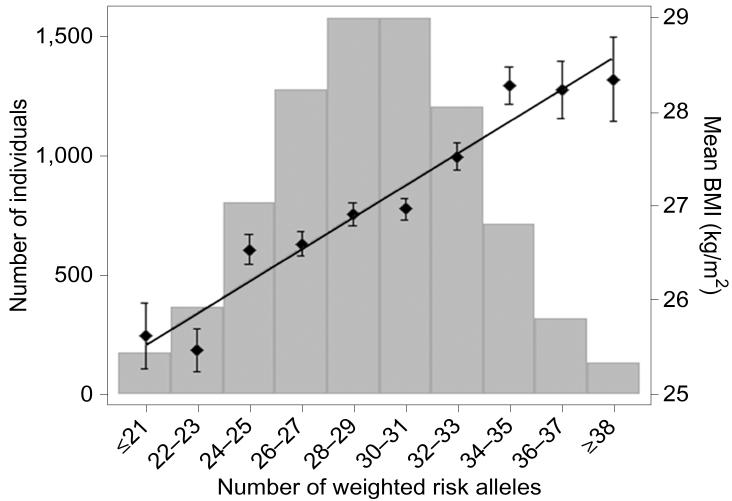
Figure 4. A polygenic score based on 32 SNPs associated with weight corrected for height (body mass index, BMI) correlates 0.12 with BMI.
Although the polygenic score only accounts for 1.5 percent of the total variance of BMI, individuals with the lowest and highest 2 percent polygenic scores differ by 8 kg, suggesting the possibility of reasonably sized research samples selected solely on the basis of polygenic scores (genotypic selection). Figure used with permission from Speliotes et al. (2010, Figure 2.1, p.940).

