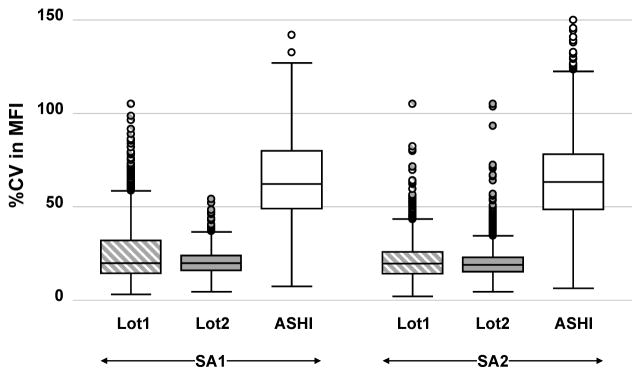
Figure 1. Laboratory variance for single antigen assays using standardized operating procedures versus non-standardized procedures.

Comparisons of %CV in MFI distributions (depicted as boxplots) from 5 centers testing SA1 (first three plots) and SA2 (second three plots) kits with CTOT materials processed under SOP (Lot1
 and Lot2
 ) or with ASHI Proficiency Test materials processed under iHOP (□).
