
Figure 3.
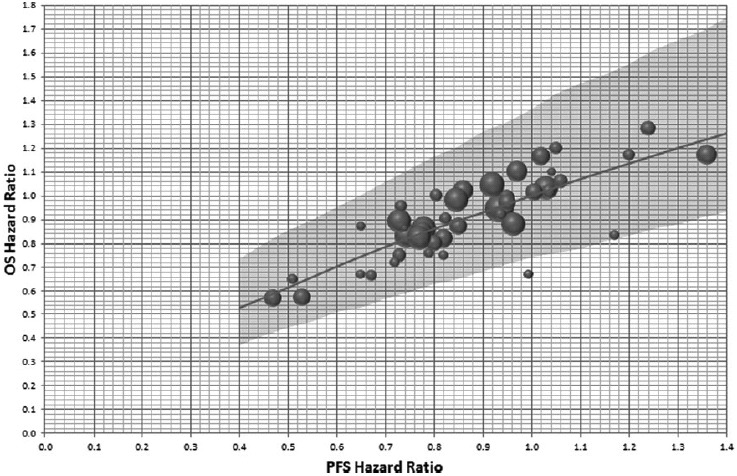
Posterior predicted OS hazard ratio with a noninformative prior. Axes are back transposed from a linear regression between OS log(HR) and PFS log(HR). The diameter of the circles is inversely proportional to the SE of the OS log(HR). Plot shows the OS HR posterior predicted mean and 95% CrI assuming a phase 2 study with 80 observed PFS events and a noninformative prior for the PFS log HR.