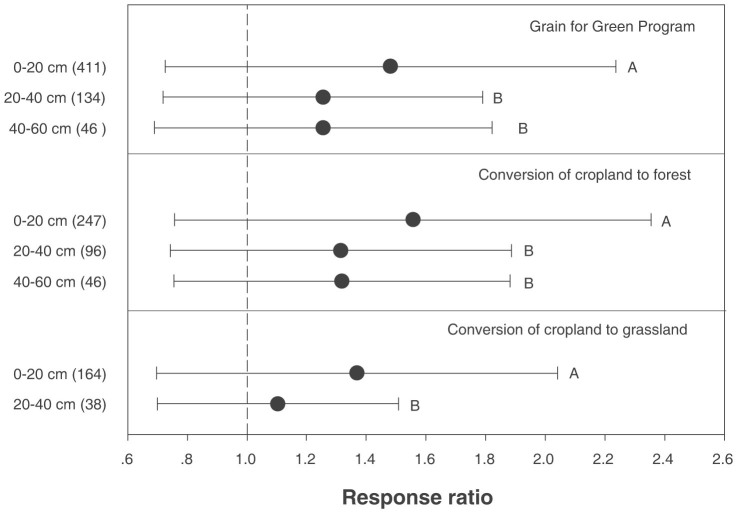
Figure 2. Untransformed response ratios pertaining to the effects of the Grain for Green Program on soil organic carbon contents at different soil depths.
Dots with error bars denote the overall mean response ratio and the 95% CI. Sampling depths (0–20 cm, 20–40 cm, and 40–60 cm) are indicated. Capital letters to the right of the bars indicate statistically significant differences between soil layers at the P < 0.05 level.

