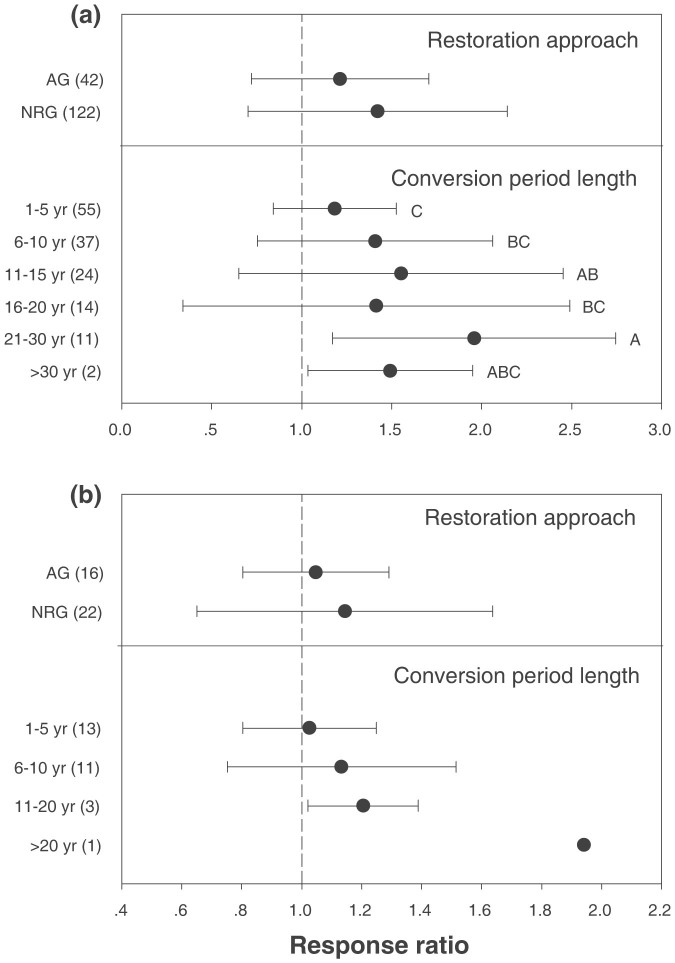
Figure 4. Untransformed response ratios pertaining to the effects of the conversion of cropland to grassland on soil organic carbon content at depths of 0–20 cm (a) and 20–40 cm (b).
Dots with error bars denote the overall mean response ratio and 95% CI. Capital letters to the right of the bars indicate statistically significant differences based on the restoration approach or conversion period at the p < 0.05 level.

