
Figure 1.
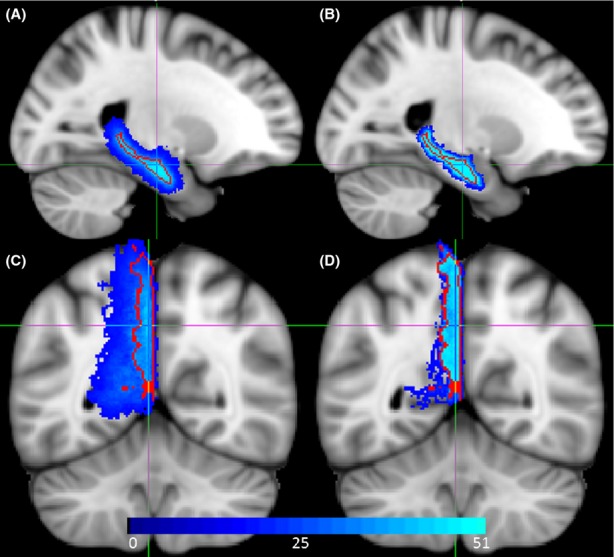
Color-coded overlay maps of (A) hippocampus and (C) precuneus regions on MNI152 brain atlas after statistical parametric mapping (SPM)8 spatial normalization. Color-coded overlay maps of (B) hippocampus and (D) precuneus regions on MNI152 brain atlas after region-based alignment. In red is the border of precuneus and hippocampus as defined in the atlas.