
Figure 3.
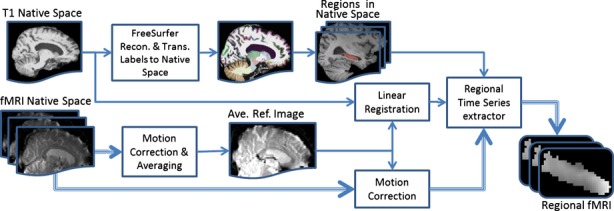
Flowchart of the fMRI data analysis in subject's native space. The thick triple line shows the flow of the fMRI data.
Official websites use .gov
A
.gov website belongs to an official
government organization in the United States.
Secure .gov websites use HTTPS
A lock (
) or https:// means you've safely
connected to the .gov website. Share sensitive
information only on official, secure websites.
Flowchart of the fMRI data analysis in subject's native space. The thick triple line shows the flow of the fMRI data.