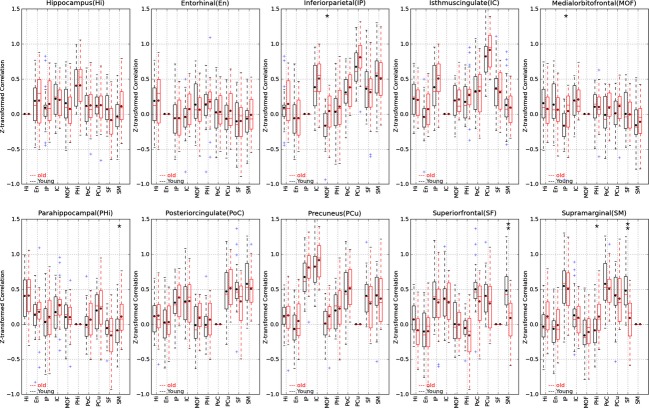
Figure 5.
Pair-wise Z-transformed correlations of the default network regions in boxplot format for right hemispheres. The box extends from the lower to upper quartile values of the data, with a line at the median. The whiskers extend from the box to show the range of the data when the outlier points are excluded. Outlier points are those that fall outside 1.5 times the interquartile range (0.25–0.75 quartile). The black dots show the means of the groups, the single asterisk is the indicative of significance difference with 0.00056 < P < 0.05, and the double asterisks is the indicative of significance level after Bonferroni correction P < 0.00056.

