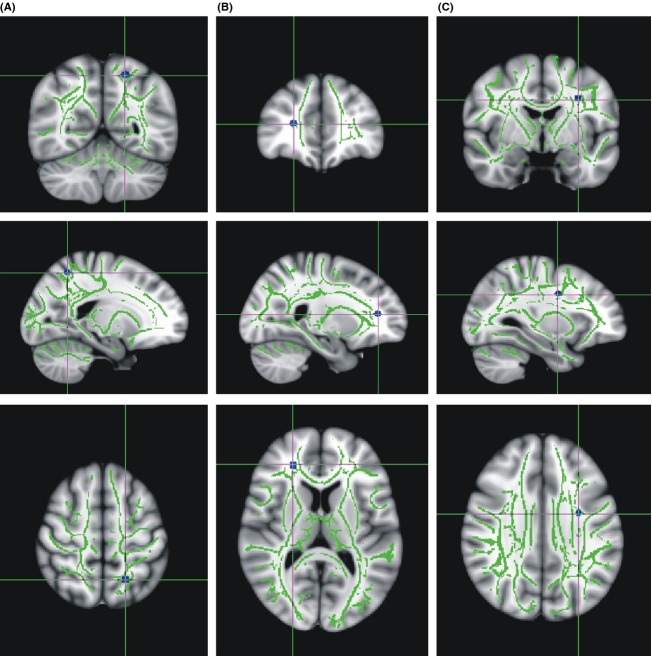
Figure 2.
Clusters of reduced FA values in homozygous C allele carriers. They were located in the left superior parietal region (−19, −60, 61) (A), the right prefrontal white matter (24, 35, 17) (B) and in the deep white matter of the left frontal lobe (−30, −7, 39). Major fiber tracts as determined by TBSS are shown in green, while blue clusters indicate decreased FA values in NRG1 risk C allele carriers (P [uncorr.] <0.001). FA, fractional anisotropy; TBSS, Tract-Based Spatial Statistics; NRG, Neuregulin.

