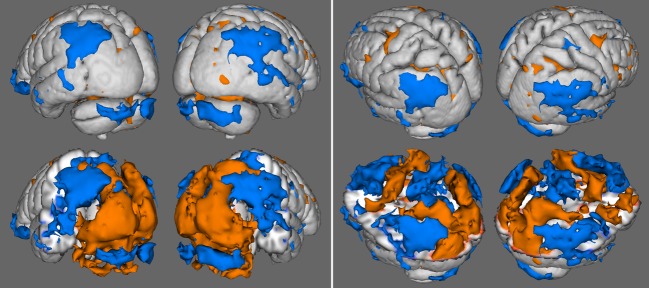
Figure 3.

Results of the group maps showing activation (light) and deactivation (dark) for the occipital and cerebellum views (left) and parietal and frontal views (right). Full anatomical surface renderings are shown in the top row, and serve as references for surface renderings in the bottom row which feature anatomy cutouts to reveal deep activation results in regions of interest.
