
Figure 6.
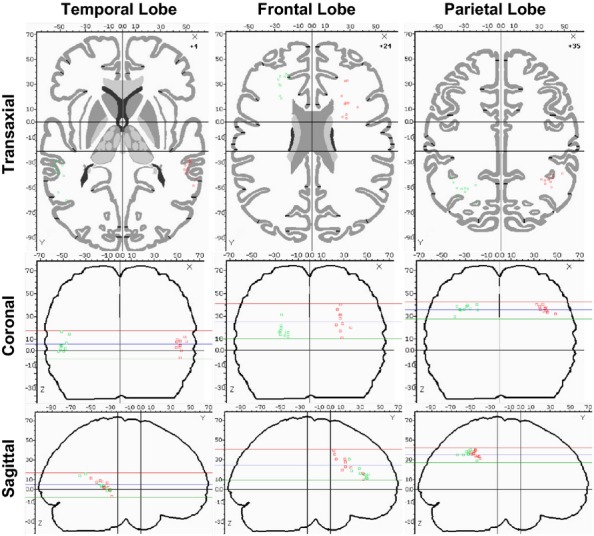
Plots of center of mass (COM) for individual deactivation results in the temporal, frontal, and parietal lobes. The horizontal lines in the coronal and sagittal images represent the top, middle, and bottom of the axial slice.
Official websites use .gov
A
.gov website belongs to an official
government organization in the United States.
Secure .gov websites use HTTPS
A lock (
) or https:// means you've safely
connected to the .gov website. Share sensitive
information only on official, secure websites.
Plots of center of mass (COM) for individual deactivation results in the temporal, frontal, and parietal lobes. The horizontal lines in the coronal and sagittal images represent the top, middle, and bottom of the axial slice.