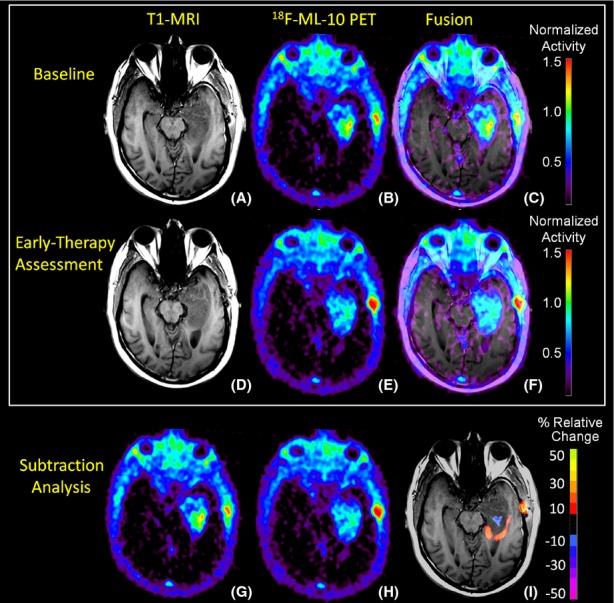
Figure 2.

Representative T1-MRI and 18F-ML-10 PET imaging sections at baseline and early-therapy assessment (ETA) time-points. At baseline, the subject's T1-MRI (A) shows left temporal lobe GBM. 18F-ML-10 uptake at baseline PET (B) shows a region of high tracer uptake corresponding to the site of the GBM on the subject's baseline T1-MRI as seen in the PET-MRI fusion image (C). After 3-weeks of therapy (RT+temozolomide), the subject received a new set of T1-MRI (D) and 18F-ML-10 PET (E) images to assess for response. (F) shows the ETA T1-MRI and 18F-ML-10 PET fusion image. Normalized voxel-by-voxel subtraction cluster map of baseline (B and G) from ETA PET (E and H) is shown fused to ETA T1-MRI. Regions of the GBM exhibiting high baseline 18F-ML-10 uptake show reduced uptake at ETA (blue), while new regions (compared to baseline) of 18F-ML-10 uptake are observed at the tumor periphery (red/orange).
