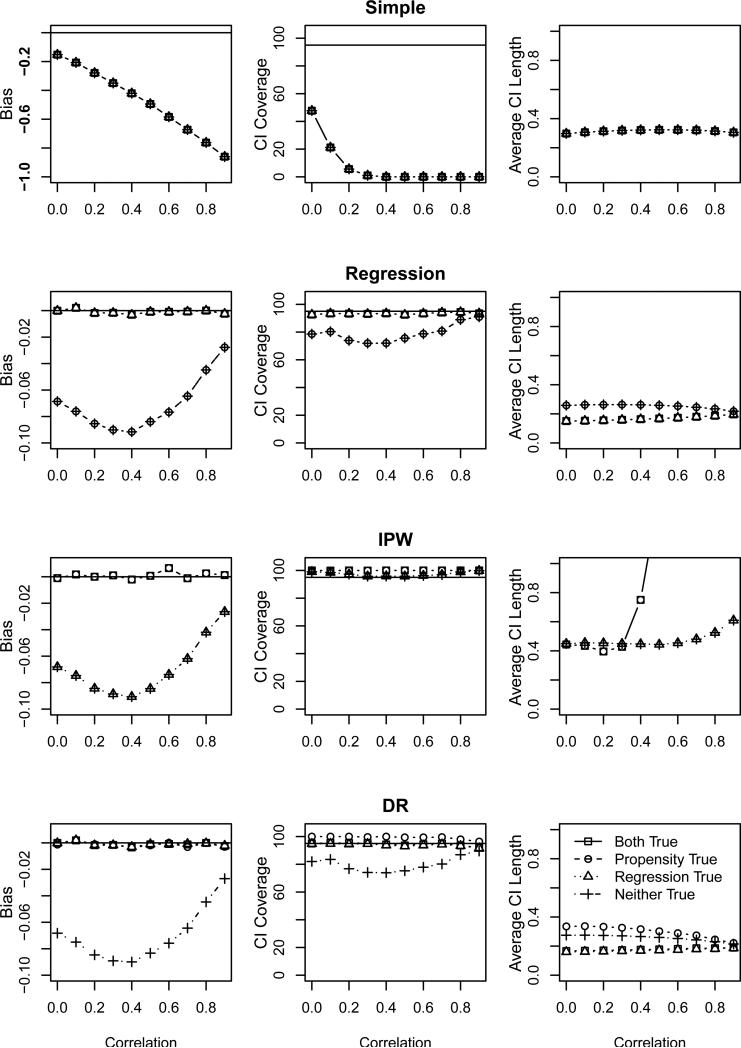
Figure 3.
Properties of as a function of covariate correlation based on the first simulation study. Each panel shows the properties for four model mis-specifications: correct propensity and response models (squares), correct propensity model and incorrect response model (circles), incorrect propensity model and correct response model (triangles), and incorrect propensity and response models (crosses). The panels in each row display the properties of based on the simple, regression, IPW, and DR SPATE estimators, respectively. The panels in the leftmost column display the bias of the estimator, where the solid horizontal line indicates no bias. Note that the vertical scale for the simple estimator is larger than the others to accommodate the much larger bias. The center column panels display the CI coverage, where the solid horizontal line indicates the nominal 95% level, and the rightmost column panels display the average CI length.

