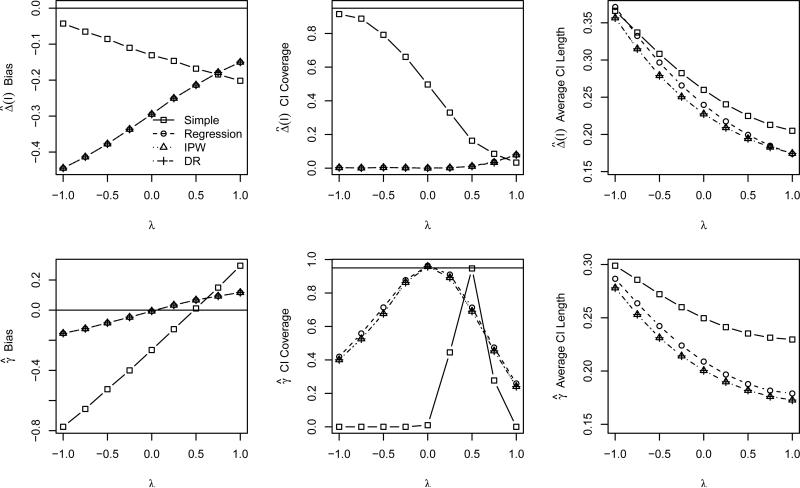
Figure 5.
Bias of using to estimate Δ (first row) and properties of (second row) as a function of covariate correlation based on the second simulation study and incorrect propensity and respse model specifications. Each panel displays results for each of the four estimators: simple (squares), regression (circle), IPW (triangle), and DR (diamonds). The panels in the leftmost column display the bias of the estimator, where the solid horizontal line indicates no bias. The center column panels display the CI coverage, where the solid horizontal line indicates the nominal 95% level, and the rightmost column panels display the average CI length.

