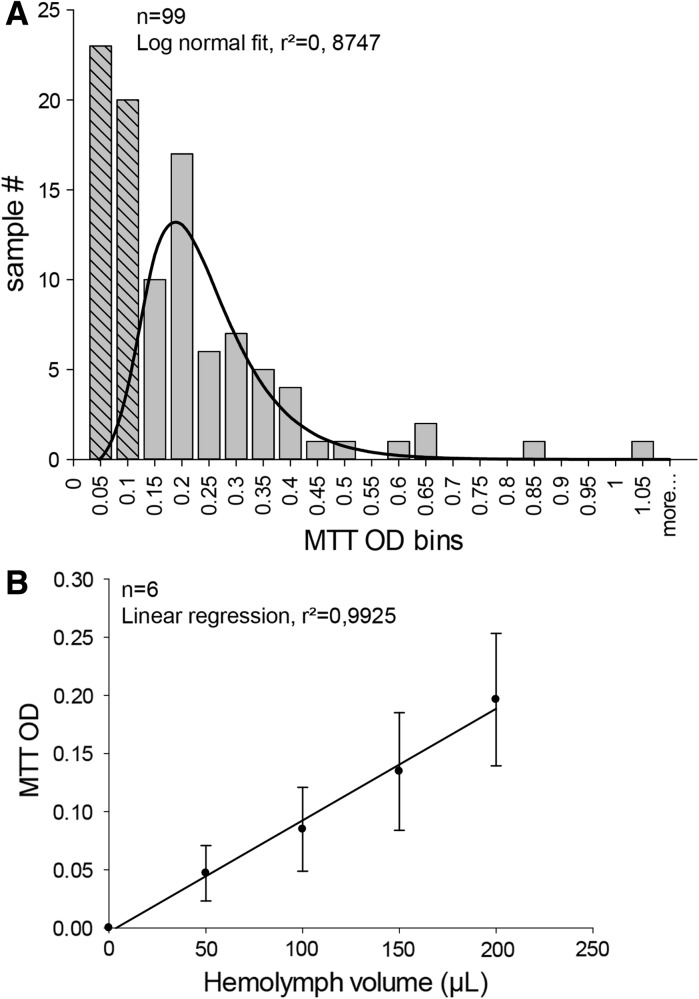
Fig. 4.
Assessment of hemocyte content in hemolymph samples by MTT bioassays. a To estimate repeatability of hemolymph withdrawal, samples of hemolymph were collected from 99 individual mussels. A volume of 200 μL from each sample was used to determine cell content via MTT bioassays. Resulting optical densities were binned into 22 levels from 0 to 1.05. The first two bins were ignored and the histogram was fitted by a Log normal distribution, giving a peak at OD = 0.22 ± 0.01 (r² = 0.87). b Volumes ranging from 50 to 200 μL of raw hemolymph from 6 mussels were used to measure linearity of MTT responses. Linear regression of mean MTT OD gives a slope of 9.91 × 10⁻⁴ ± 2.80 × 10⁻⁴ MTT O.D. unit/hemolymph μL with r² = 0.9925

